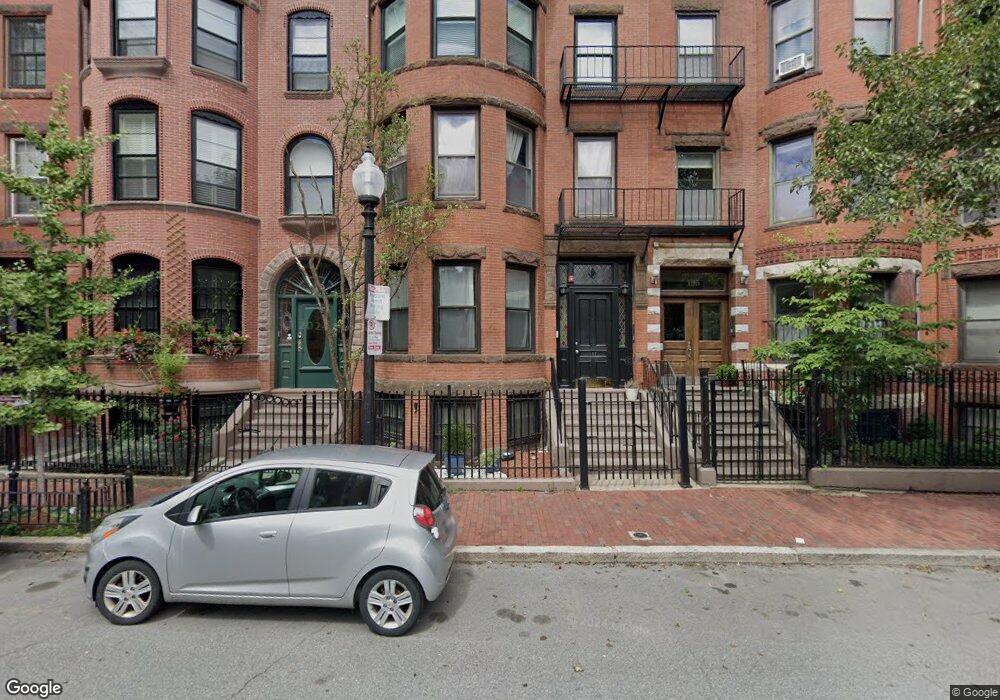
197 Saint Botolph St Unit 6 Boston, MA 02115
Back Bay NeighborhoodEstimated Value: $1,312,000 - $1,518,000
2
Beds
2
Baths
1,255
Sq Ft
$1,121/Sq Ft
Est. Value
About This Home
This home is located at 197 Saint Botolph St Unit 6, Boston, MA 02115 and is currently estimated at $1,406,325, approximately $1,120 per square foot. 197 Saint Botolph St Unit 6 is a home located in Suffolk County with nearby schools including Edward M. Kennedy Academy for Health Careers, Kingsley Montessori School, and The Newman School.
Ownership History
Date
Name
Owned For
Owner Type
Purchase Details
Closed on
Jun 25, 2007
Sold by
Luke Judith
Bought by
Vanvleck Valerie
Current Estimated Value
Home Financials for this Owner
Home Financials are based on the most recent Mortgage that was taken out on this home.
Original Mortgage
$395,000
Interest Rate
6.14%
Mortgage Type
Purchase Money Mortgage
Purchase Details
Closed on
Sep 2, 1998
Sold by
Gomendio Ingnacio and Gomendio Jose E
Bought by
Luke Judith
Home Financials for this Owner
Home Financials are based on the most recent Mortgage that was taken out on this home.
Original Mortgage
$279,200
Interest Rate
6.9%
Mortgage Type
Purchase Money Mortgage
Purchase Details
Closed on
Dec 24, 1987
Sold by
Digiacomo James
Bought by
Gomendio I
Home Financials for this Owner
Home Financials are based on the most recent Mortgage that was taken out on this home.
Original Mortgage
$275,000
Interest Rate
10.67%
Mortgage Type
Purchase Money Mortgage
Create a Home Valuation Report for This Property
The Home Valuation Report is an in-depth analysis detailing your home's value as well as a comparison with similar homes in the area
Home Values in the Area
Average Home Value in this Area
Purchase History
| Date | Buyer | Sale Price | Title Company |
|---|---|---|---|
| Vanvleck Valerie | $795,000 | -- | |
| Luke Judith | $349,000 | -- | |
| Gomendio I | $275,000 | -- |
Source: Public Records
Mortgage History
| Date | Status | Borrower | Loan Amount |
|---|---|---|---|
| Open | Vanvleck Valerie | $312,000 | |
| Closed | Vleck | $364,000 | |
| Closed | Gomendio I | $372,000 | |
| Closed | Gomendio I | $387,124 | |
| Closed | Vanvleck Valerie | $395,000 | |
| Previous Owner | Gomendio I | $279,200 | |
| Previous Owner | Gomendio I | $275,000 |
Source: Public Records
Tax History Compared to Growth
Tax History
| Year | Tax Paid | Tax Assessment Tax Assessment Total Assessment is a certain percentage of the fair market value that is determined by local assessors to be the total taxable value of land and additions on the property. | Land | Improvement |
|---|---|---|---|---|
| 2025 | $14,636 | $1,263,900 | $0 | $1,263,900 |
| 2024 | $13,250 | $1,215,600 | $0 | $1,215,600 |
| 2023 | $12,670 | $1,179,700 | $0 | $1,179,700 |
| 2022 | $12,224 | $1,123,500 | $0 | $1,123,500 |
| 2021 | $11,988 | $1,123,500 | $0 | $1,123,500 |
| 2020 | $11,455 | $1,084,800 | $0 | $1,084,800 |
| 2019 | $11,101 | $1,053,200 | $0 | $1,053,200 |
| 2018 | $10,414 | $993,700 | $0 | $993,700 |
| 2017 | $9,931 | $937,800 | $0 | $937,800 |
| 2016 | $9,919 | $901,700 | $0 | $901,700 |
| 2015 | $9,980 | $824,100 | $0 | $824,100 |
| 2014 | $9,514 | $756,300 | $0 | $756,300 |
Source: Public Records
Map
Nearby Homes
- 159 St Botolph St Unit 3
- 15 Blackwood St Unit 2
- 26 Claremont Park Unit 2
- 10 Cumberland St Unit 10-3
- 21 Claremont Park
- 6 Wellington St Unit 1
- 270 Huntington Ave Unit 304
- 30 Cumberland St
- 119 Saint Botolph St Unit 2
- 519 Columbus Ave Unit 1
- 566 Columbus Ave Unit 614
- 451-453 Massachusetts Ave Unit 8
- 460 Massachusetts Ave Unit B
- 455 Massachusetts Ave Unit 1
- 455 Massachusetts Ave Unit 2
- 1 Dalton St Unit 3003
- 1 Dalton St Unit 5801/5802
- 1 Dalton St Unit 3108
- 1 Dalton St Unit 3506
- 1 Dalton St Unit 5102
- 203 Saint Botolph St Unit 4
- 203 Saint Botolph St Unit 3
- 203 Saint Botolph St Unit 2
- 203 Saint Botolph St Unit 1
- 203 Saint Botolph St Unit 11
- 203 Saint Botolph St Unit studio
- 203 Saint Botolph St Unit 12
- 203 Saint Botolph St Unit 10
- 201 Saint Botolph St Unit 6
- 201 Saint Botolph St Unit 5
- 201 Saint Botolph St Unit 4
- 201 Saint Botolph St Unit 3
- 201 Saint Botolph St Unit 2
- 201 Saint Botolph St Unit 1
- 201 Saint Botolph St Unit 5,201
- 197 Saint Botolph St Unit 5
- 197 Saint Botolph St Unit 4
- 197 Saint Botolph St Unit 3
- 197 Saint Botolph St Unit 2
- 197 Saint Botolph St Unit 1