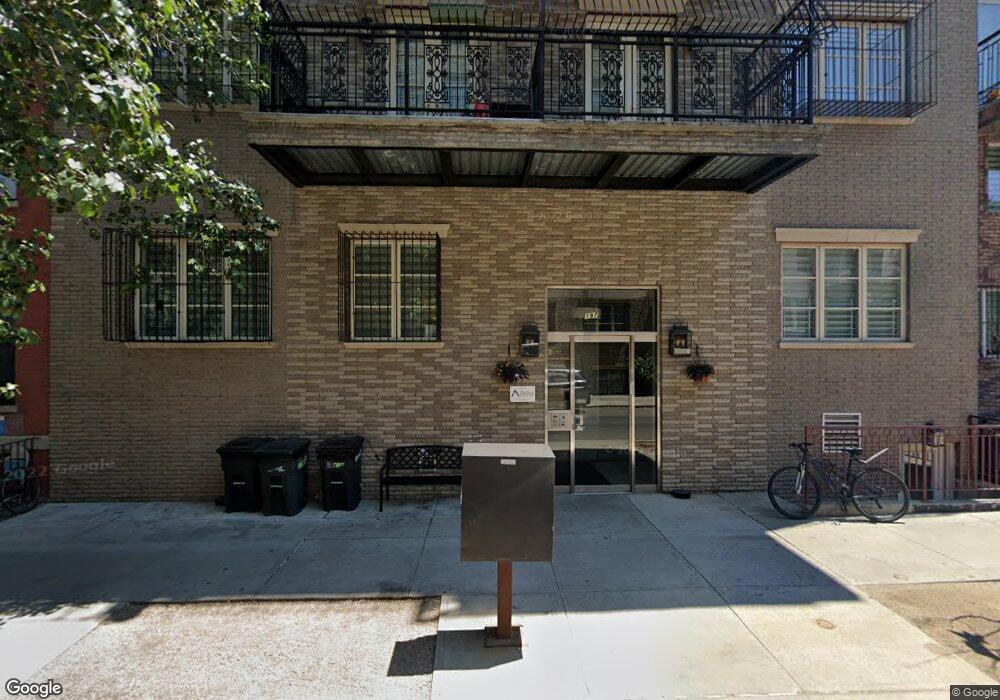
197 Skillman St Unit 3B Brooklyn, NY 11205
Bed-Stuy NeighborhoodEstimated Value: $1,052,000 - $1,281,000
--
Bed
--
Bath
1,294
Sq Ft
$913/Sq Ft
Est. Value
About This Home
This home is located at 197 Skillman St Unit 3B, Brooklyn, NY 11205 and is currently estimated at $1,180,882, approximately $912 per square foot. 197 Skillman St Unit 3B is a home located in Kings County with nearby schools including P.S. 54 - Samuel C. Barnes, The Brooklyn Charter School, and Bnos Square of Williamsburg.
Ownership History
Date
Name
Owned For
Owner Type
Purchase Details
Closed on
Jul 22, 2024
Sold by
Gross Menachem Hillel
Bought by
Brecher Esther and Brecher Brecher
Current Estimated Value
Home Financials for this Owner
Home Financials are based on the most recent Mortgage that was taken out on this home.
Original Mortgage
$915,000
Outstanding Balance
$903,796
Interest Rate
6.86%
Mortgage Type
Purchase Money Mortgage
Estimated Equity
$277,086
Purchase Details
Closed on
Dec 3, 2019
Sold by
Gross David I
Bought by
Gross Menachem Hillel
Purchase Details
Closed on
May 11, 2015
Sold by
195 Skillman Realty Llc
Bought by
Gross David I
Home Financials for this Owner
Home Financials are based on the most recent Mortgage that was taken out on this home.
Original Mortgage
$417,000
Interest Rate
3.65%
Mortgage Type
New Conventional
Create a Home Valuation Report for This Property
The Home Valuation Report is an in-depth analysis detailing your home's value as well as a comparison with similar homes in the area
Home Values in the Area
Average Home Value in this Area
Purchase History
| Date | Buyer | Sale Price | Title Company |
|---|---|---|---|
| Brecher Esther | $995,000 | -- | |
| Gross Menachem Hillel | -- | -- | |
| Gross Menachem Hillel | -- | -- | |
| Gross David I | $545,000 | -- | |
| Gross David I | $545,000 | -- |
Source: Public Records
Mortgage History
| Date | Status | Borrower | Loan Amount |
|---|---|---|---|
| Open | Brecher Esther | $915,000 | |
| Previous Owner | Gross David I | $417,000 |
Source: Public Records
Tax History Compared to Growth
Tax History
| Year | Tax Paid | Tax Assessment Tax Assessment Total Assessment is a certain percentage of the fair market value that is determined by local assessors to be the total taxable value of land and additions on the property. | Land | Improvement |
|---|---|---|---|---|
| 2025 | $103 | $136,937 | $12,373 | $124,564 |
| 2024 | $103 | $114,122 | $12,373 | $101,749 |
| 2023 | $103 | $95,101 | $12,373 | $82,728 |
| 2022 | $101 | $93,436 | $12,373 | $81,063 |
| 2021 | $101 | $95,601 | $12,373 | $83,228 |
| 2020 | $103 | $92,826 | $12,373 | $80,453 |
| 2019 | $104 | $77,369 | $12,373 | $64,996 |
| 2018 | $105 | $60,296 | $11,571 | $48,725 |
| 2017 | $105 | $60,296 | $10,994 | $49,302 |
| 2016 | $106 | $60,296 | $10,448 | $49,848 |
| 2015 | -- | $54,200 | $1,054 | $53,146 |
Source: Public Records
Map
Nearby Homes
- 192 Spencer St Unit 3A
- 192 Spencer St Unit 1E
- 192 Spencer St Unit 1-D
- 192 Spencer St Unit 4-E
- 195 Spencer St Unit 7B
- 197 Spencer St Unit 3B
- 244 Franklin Ave Unit 5B
- 689 Myrtle Ave Unit 4E
- 689 Myrtle Ave Unit 2E
- 609 Myrtle Ave Unit 2A
- 102 Walworth St
- 452 Lafayette Ave Unit 4B
- 433 Dekalb Ave
- 610 Dekalb Ave Unit 4
- 218 Classon Ave Unit GARDEN
- 548 Lafayette Ave Unit 2
- 196 Clifton Place
- 149 Clifton Place Unit 3
- 327 Franklin Ave
- 627 Dekalb Ave Unit 2D
- 197 Skillman St
- 197 Skillman St Unit 4A
- 197 Skillman St Unit 1A
- 197 Skillman St Unit 2A
- 197 Skillman St Unit 4B
- 197 Skillman St Unit 3A
- 197 Skillman St Unit 2B
- 197 Skillman St Unit 1B
- 199 Skillman St
- 193 Skillman St
- 191 Skillman St
- 948 Bedford Ave
- 946 Bedford Ave
- 942-944 Bedford Ave
- 185 Skillman St
- 185 Skillman St Unit 2
- 950 Bedford Ave
- 940 Bedford Ave
- 183 Skillman St
- 952 Bedford Ave