1970 Allen St Springfield, MA 01118
Sixteen Acres NeighborhoodEstimated Value: $378,000 - $423,970
3
Beds
3
Baths
1,628
Sq Ft
$243/Sq Ft
Est. Value
About This Home
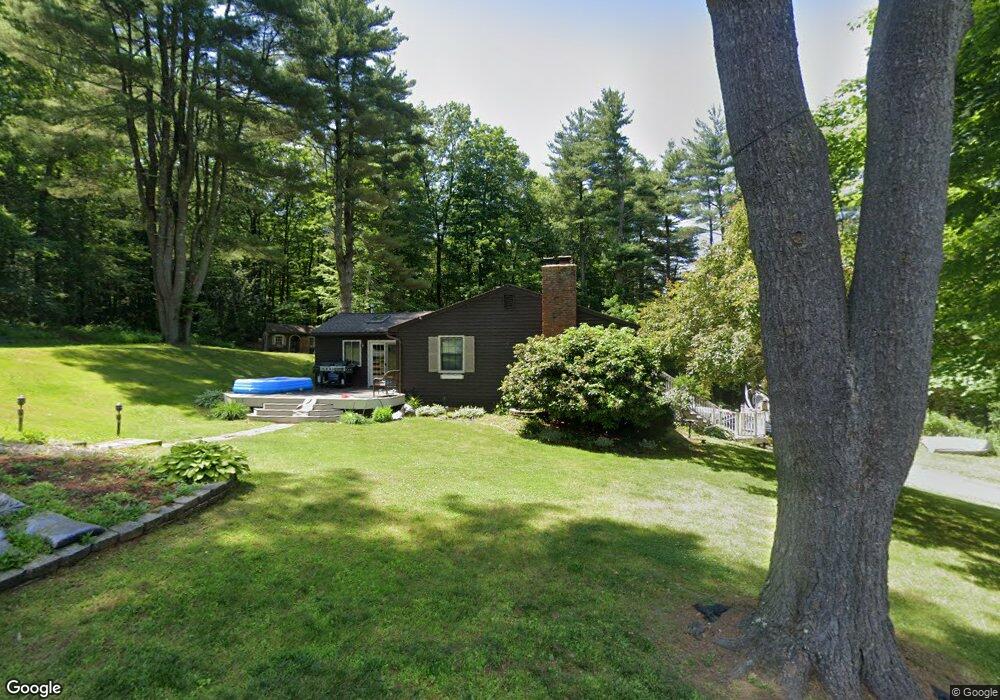
This home is located at 1970 Allen St, Springfield, MA 01118 and is currently estimated at $395,993, approximately $243 per square foot. 1970 Allen St is a home located in Hampden County with nearby schools including Daniel B Brunton, M Marcus Kiley Middle, and Springfield High School of Science and Technology.
Ownership History
Date
Name
Owned For
Owner Type
Purchase Details
Closed on
Jun 18, 2007
Sold by
Degray James P
Bought by
Degray James P and Degray Michele A
Current Estimated Value
Home Financials for this Owner
Home Financials are based on the most recent Mortgage that was taken out on this home.
Original Mortgage
$170,000
Outstanding Balance
$104,022
Interest Rate
6.19%
Mortgage Type
Purchase Money Mortgage
Estimated Equity
$291,971
Purchase Details
Closed on
Nov 17, 1995
Sold by
Laing David A and Laing Susan S
Bought by
Degray James P and Rucinski Mary
Home Financials for this Owner
Home Financials are based on the most recent Mortgage that was taken out on this home.
Original Mortgage
$108,896
Interest Rate
7.53%
Mortgage Type
Purchase Money Mortgage
Create a Home Valuation Report for This Property
The Home Valuation Report is an in-depth analysis detailing your home's value as well as a comparison with similar homes in the area
Home Values in the Area
Average Home Value in this Area
Purchase History
| Date | Buyer | Sale Price | Title Company |
|---|---|---|---|
| Degray James P | -- | -- | |
| Degray James P | $109,000 | -- |
Source: Public Records
Mortgage History
| Date | Status | Borrower | Loan Amount |
|---|---|---|---|
| Open | Degray James P | $170,000 | |
| Previous Owner | Degray James P | $124,900 | |
| Previous Owner | Degray James P | $108,896 | |
| Previous Owner | Degray James P | $90,000 |
Source: Public Records
Tax History Compared to Growth
Tax History
| Year | Tax Paid | Tax Assessment Tax Assessment Total Assessment is a certain percentage of the fair market value that is determined by local assessors to be the total taxable value of land and additions on the property. | Land | Improvement |
|---|---|---|---|---|
| 2025 | $5,436 | $346,700 | $74,600 | $272,100 |
| 2024 | $5,120 | $318,800 | $74,600 | $244,200 |
| 2023 | $4,793 | $281,100 | $71,100 | $210,000 |
| 2022 | $4,566 | $242,600 | $71,100 | $171,500 |
| 2021 | $4,438 | $234,800 | $64,600 | $170,200 |
| 2020 | $4,388 | $224,700 | $64,600 | $160,100 |
| 2019 | $4,278 | $217,400 | $64,600 | $152,800 |
| 2018 | $3,832 | $194,700 | $64,600 | $130,100 |
| 2017 | $3,667 | $186,500 | $64,600 | $121,900 |
| 2016 | $3,566 | $181,400 | $64,600 | $116,800 |
| 2015 | $3,566 | $181,300 | $64,600 | $116,700 |
Source: Public Records
Map
Nearby Homes
- 32 Lindsay Rd
- 0 Apple Blossom Ln
- 111 Malibu Dr
- 399 Elm St
- 15 Lynwood Rd
- 17 Skyridge Ln
- 1815 Parker St
- 41 Kerry Dr
- 41 Hillside Dr
- 331 Grand Valley Rd
- 65 Fair Oak Rd
- 1680 Parker St
- 331 Newhouse St
- 82 Louis Rd
- 86 Talmadge Dr
- 99 W Crystal Brook Dr
- 84 Brookhaven Dr
- 98 Brookhaven Dr
- 17 Pebble Mill Rd
- 31 Acrebrook Rd
- 1962 Allen St
- 2020 Allen St
- 1950 Allen St
- 2030 Allen St
- 200 Ellendale Cir
- 190 Ellendale Cir
- 208 Ellendale Cir
- 34 Pine Grove Cir
- 218 Ellendale Cir
- 28 Pine Grove Cir
- 27 Woodridge Dr
- 2044 Allen St
- 2031 Allen St
- 15 Woodridge Dr
- 184 Ellendale Cir
- 1920 Allen St
- 226 Ellendale Cir
- 2055 Allen St
- 40 Pine Grove Cir
- 1929 Allen St