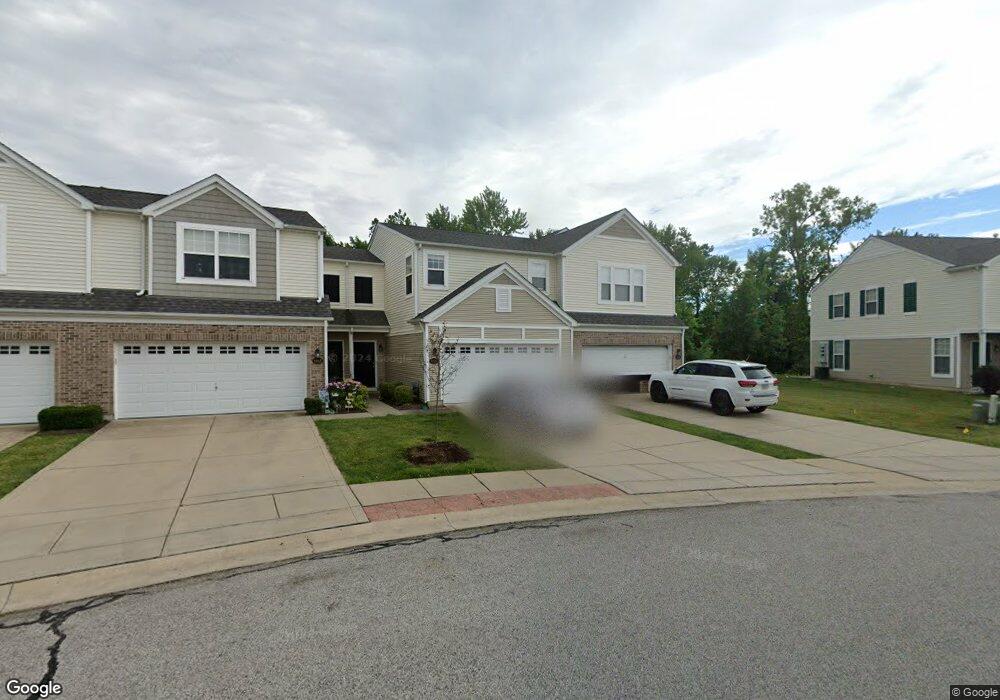
1970 Celebration Park Cir Unit Lot323 Belleville, IL 62220
Estimated Value: $156,000 - $178,000
2
Beds
2
Baths
1,514
Sq Ft
$113/Sq Ft
Est. Value
About This Home
This home is located at 1970 Celebration Park Cir Unit Lot323, Belleville, IL 62220 and is currently estimated at $171,566, approximately $113 per square foot. 1970 Celebration Park Cir Unit Lot323 is a home located in St. Clair County with nearby schools including Westhaven Elementary School, Central Jr High School, and Notre Dame Academy of Belleville.
Ownership History
Date
Name
Owned For
Owner Type
Purchase Details
Closed on
Jun 29, 2015
Sold by
Mahmood Maher
Bought by
Properties 4 Rent Llc 1970
Current Estimated Value
Purchase Details
Closed on
Apr 17, 2015
Sold by
The Secretary Of Housing & Urban Develop
Bought by
Mahmood Maher
Purchase Details
Closed on
Jan 8, 2013
Sold by
Lee Erick
Bought by
The Secretary Of Housing & Urban Develop
Purchase Details
Closed on
Feb 27, 2007
Sold by
The Jones Co Homes Llc
Bought by
Lee Erick T
Home Financials for this Owner
Home Financials are based on the most recent Mortgage that was taken out on this home.
Original Mortgage
$130,275
Interest Rate
6.27%
Mortgage Type
FHA
Purchase Details
Closed on
Jan 6, 2006
Sold by
Reunion Development Llc
Bought by
The Jones Co Homes Llc
Create a Home Valuation Report for This Property
The Home Valuation Report is an in-depth analysis detailing your home's value as well as a comparison with similar homes in the area
Home Values in the Area
Average Home Value in this Area
Purchase History
| Date | Buyer | Sale Price | Title Company |
|---|---|---|---|
| Properties 4 Rent Llc 1970 | -- | Attorney | |
| Mahmood Maher | -- | Benchmark Title Company | |
| The Secretary Of Housing & Urban Develop | -- | None Available | |
| Lee Erick T | $132,500 | Commerce Land Title Inc | |
| The Jones Co Homes Llc | $312,000 | Benchmark Title Company |
Source: Public Records
Mortgage History
| Date | Status | Borrower | Loan Amount |
|---|---|---|---|
| Previous Owner | Lee Erick T | $130,275 |
Source: Public Records
Tax History Compared to Growth
Tax History
| Year | Tax Paid | Tax Assessment Tax Assessment Total Assessment is a certain percentage of the fair market value that is determined by local assessors to be the total taxable value of land and additions on the property. | Land | Improvement |
|---|---|---|---|---|
| 2024 | $4,281 | $48,681 | $5,452 | $43,229 |
| 2023 | $4,119 | $43,883 | $5,092 | $38,791 |
| 2022 | $3,781 | $39,506 | $4,584 | $34,922 |
| 2021 | $3,663 | $36,734 | $4,449 | $32,285 |
| 2020 | $3,560 | $34,738 | $4,208 | $30,530 |
| 2019 | $2,760 | $26,642 | $4,215 | $22,427 |
| 2018 | $2,699 | $26,066 | $4,124 | $21,942 |
| 2017 | $2,690 | $25,883 | $4,095 | $21,788 |
| 2016 | $2,668 | $31,353 | $4,008 | $27,345 |
| 2014 | $3,278 | $35,087 | $5,256 | $29,831 |
| 2013 | $2,740 | $35,589 | $5,331 | $30,258 |
Source: Public Records
Map
Nearby Homes
- 2056 Celebration Park Cir
- 1937 Richmond Springs Ln
- 133 Rivermeade Ln
- 1913 Plantation Ln
- 1909 Plantation Ln
- 244 River Laurel Dr
- 1620 Westhaven Dr
- 2042 Woodsong Way Ln
- 1617 S Illinois St
- 91-110 Westhaven Meadows Dr
- 46 Meadowview Dr
- 1433 Fairwood Dr
- 1412 Fairwood Dr
- 1500 State Street Rd
- 1250 Lakeshore Dr
- 1031 S Charles St
- 304 S Belt W
- 928 S High St
- 33 Forest Gate Dr
- 907 S Jackson St
- 1970 Celebration Park Cir
- 1968 Celebration Park Cir
- 1972 Celebration Park Cir
- 1966 Celebration Park Cir
- 2000 Celebration Park Cir
- 2002 Celebration Park Cir
- 1962 Celebration Park Cir
- 2004 Celebration Park Cir
- 2006 Celebration Park Cir
- 2006 Celebration
- 1960 Celebration Park Cir
- 2008 Celebration Park Cir
- 1958 Celebration Park Cir
- 1953 Celebration Park Cir
- 2010 Celebration Park Cir
- 101 Liberty Torch Ct
- 100 Liberty Torch Ct
- 2021 Celebration Park Cir
- 1956 Celebration Park Cir
- 1951 Celebration Park Cir