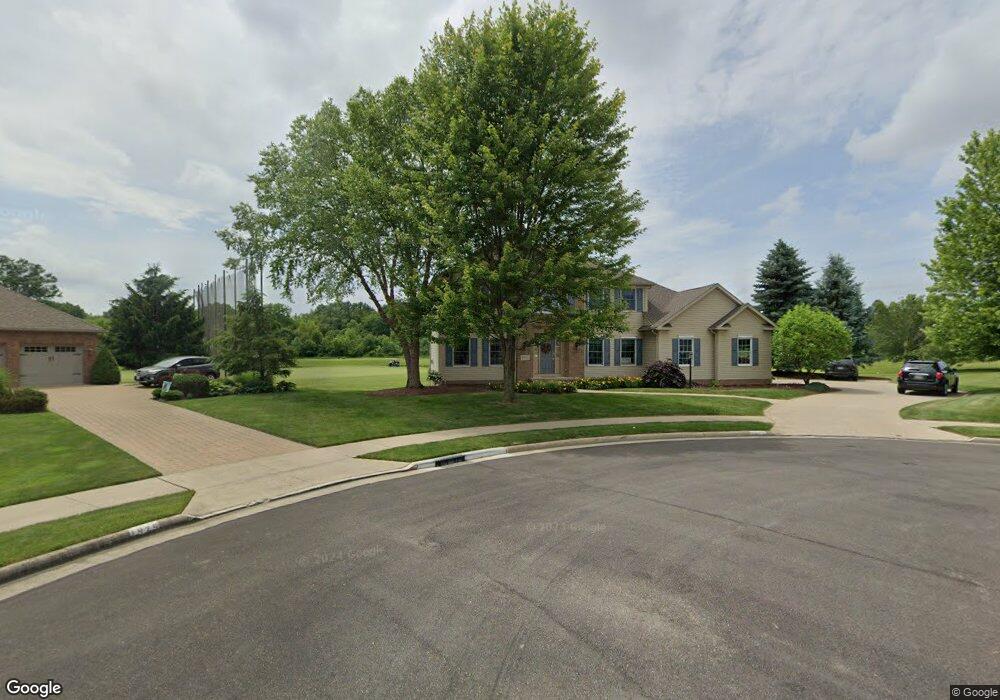
1970 Masters Point Cir SE Massillon, OH 44646
Southeast Massillon NeighborhoodEstimated Value: $460,237 - $554,000
4
Beds
3
Baths
2,521
Sq Ft
$198/Sq Ft
Est. Value
About This Home
This home is located at 1970 Masters Point Cir SE, Massillon, OH 44646 and is currently estimated at $498,309, approximately $197 per square foot. 1970 Masters Point Cir SE is a home located in Stark County with nearby schools including Pfeiffer Intermediate School, Edison Middle School, and Perry High School.
Ownership History
Date
Name
Owned For
Owner Type
Purchase Details
Closed on
Oct 6, 2014
Sold by
Tournoux Mark A
Bought by
Ellis Matthew J and Ellis Lisa M
Current Estimated Value
Home Financials for this Owner
Home Financials are based on the most recent Mortgage that was taken out on this home.
Original Mortgage
$194,400
Outstanding Balance
$148,871
Interest Rate
4.07%
Mortgage Type
New Conventional
Estimated Equity
$349,438
Purchase Details
Closed on
Jun 14, 2005
Sold by
K Hovnanian Summit Homes Llc
Bought by
Tournoux Mark A
Home Financials for this Owner
Home Financials are based on the most recent Mortgage that was taken out on this home.
Original Mortgage
$79,000
Interest Rate
5.82%
Mortgage Type
Fannie Mae Freddie Mac
Purchase Details
Closed on
Nov 24, 2003
Sold by
Janda Development Ltd
Bought by
K Hovnanian Summit Homes Llc
Create a Home Valuation Report for This Property
The Home Valuation Report is an in-depth analysis detailing your home's value as well as a comparison with similar homes in the area
Home Values in the Area
Average Home Value in this Area
Purchase History
| Date | Buyer | Sale Price | Title Company |
|---|---|---|---|
| Ellis Matthew J | $243,000 | None Available | |
| Tournoux Mark A | $225,100 | -- | |
| K Hovnanian Summit Homes Llc | $70,900 | -- |
Source: Public Records
Mortgage History
| Date | Status | Borrower | Loan Amount |
|---|---|---|---|
| Open | Ellis Matthew J | $194,400 | |
| Previous Owner | Tournoux Mark A | $79,000 |
Source: Public Records
Tax History Compared to Growth
Tax History
| Year | Tax Paid | Tax Assessment Tax Assessment Total Assessment is a certain percentage of the fair market value that is determined by local assessors to be the total taxable value of land and additions on the property. | Land | Improvement |
|---|---|---|---|---|
| 2025 | -- | $141,260 | $39,200 | $102,060 |
| 2024 | -- | $141,260 | $39,200 | $102,060 |
| 2023 | $4,253 | $98,950 | $29,750 | $69,200 |
| 2022 | $4,219 | $98,950 | $29,750 | $69,200 |
| 2021 | $4,539 | $98,950 | $29,750 | $69,200 |
| 2020 | $4,196 | $90,060 | $26,880 | $63,180 |
| 2019 | $3,694 | $90,060 | $26,880 | $63,180 |
| 2018 | $3,629 | $90,060 | $26,880 | $63,180 |
| 2017 | $3,533 | $82,990 | $24,260 | $58,730 |
| 2016 | $3,553 | $82,990 | $24,260 | $58,730 |
| 2015 | $3,589 | $82,990 | $24,260 | $58,730 |
| 2014 | $1,427 | $75,320 | $22,540 | $52,780 |
| 2013 | $1,670 | $72,980 | $25,060 | $47,920 |
Source: Public Records
Map
Nearby Homes
- 1572 Championship Cir SE
- 1553 Championship Cir SE
- Lot #47 Championship Cir SE
- Lot #51 Championship Cir SE
- Lot #28 Championship Cir SE
- 2120 Championship Cir SE
- 2150 Championship Cir SE
- Lot 19 Candell St SE
- Lot# 18 Candell St SE
- Lot# 17 Candell St SE
- Lot# 14 Candell St SE
- Lot# 12 Candell St SE
- Lot# 11 Candell St SE
- Lot# 10 Candell St SE
- Lot# 9 Candell St SE
- Lot# 8 Candell St SE
- Lot# 7 Candell St SE
- Lot# 6 Candell St SE
- Lot# 5 Candell St SE
- Lot# 4 Candell St SE
- 1982 Masters Point Cir SE
- 62 Masters Point Cir SE Unit 62
- 62 Masters Point SE
- 1975 Masters Point Cir SE
- 1983 Masters Point Cir SE
- 1991 Masters Point Cir SE
- 1991 Masters Point SE
- 2018 Masters Point Cir SE
- 2013 Masters Point Cir SE
- 1977 Triple Crown Cir SE
- 2035 Masters Point Cir SE
- 1974 Triple Crown Cir SE
- 2040 Masters Point Cir SE
- 1983 Triple Crown Cir
- 2047 Masters Point SE
- 2047 Masters Point Cir SE
- 9999 Championship Cir SE
- 2011 Triple Crown Cir SE
- 1986 Triple Crown Cir SE
- 1690 Championship Cir SE