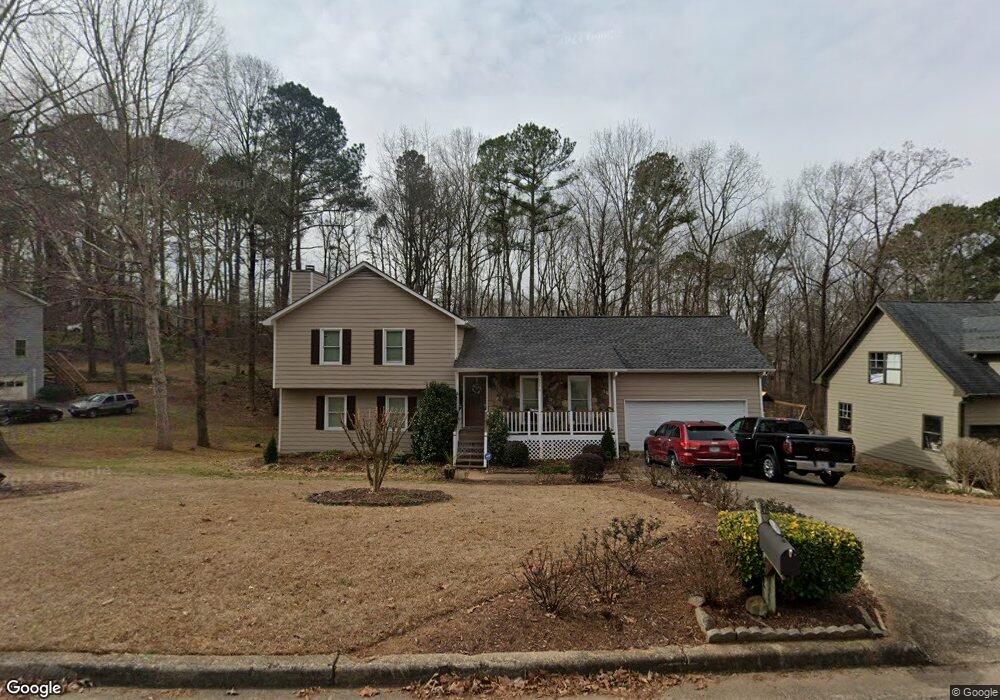
1970 Oak Village Ln Unit 2 Lawrenceville, GA 30043
Estimated Value: $349,000 - $367,000
3
Beds
2
Baths
1,490
Sq Ft
$243/Sq Ft
Est. Value
About This Home
This home is located at 1970 Oak Village Ln Unit 2, Lawrenceville, GA 30043 and is currently estimated at $362,082, approximately $243 per square foot. 1970 Oak Village Ln Unit 2 is a home located in Gwinnett County with nearby schools including Taylor Elementary School, Creekland Middle School, and Collins Hill High School.
Ownership History
Date
Name
Owned For
Owner Type
Purchase Details
Closed on
Oct 9, 2002
Sold by
Arrue Anibal
Bought by
Arrue Anibal and Arrue Silvia M
Current Estimated Value
Home Financials for this Owner
Home Financials are based on the most recent Mortgage that was taken out on this home.
Original Mortgage
$119,000
Interest Rate
6.18%
Mortgage Type
New Conventional
Purchase Details
Closed on
Aug 10, 2000
Sold by
Burns Loneryl
Bought by
Arrue Anibal
Home Financials for this Owner
Home Financials are based on the most recent Mortgage that was taken out on this home.
Original Mortgage
$117,035
Interest Rate
8.17%
Mortgage Type
FHA
Purchase Details
Closed on
Apr 5, 2000
Sold by
Owens Helen A
Bought by
Burns Loneryl
Home Financials for this Owner
Home Financials are based on the most recent Mortgage that was taken out on this home.
Original Mortgage
$88,092
Interest Rate
8.27%
Mortgage Type
FHA
Create a Home Valuation Report for This Property
The Home Valuation Report is an in-depth analysis detailing your home's value as well as a comparison with similar homes in the area
Home Values in the Area
Average Home Value in this Area
Purchase History
| Date | Buyer | Sale Price | Title Company |
|---|---|---|---|
| Arrue Anibal | -- | -- | |
| Arrue Anibal | $118,000 | -- | |
| Burns Loneryl | $88,600 | -- |
Source: Public Records
Mortgage History
| Date | Status | Borrower | Loan Amount |
|---|---|---|---|
| Closed | Arrue Anibal | $119,000 | |
| Previous Owner | Arrue Anibal | $117,035 | |
| Previous Owner | Burns Loneryl | $88,092 |
Source: Public Records
Tax History Compared to Growth
Tax History
| Year | Tax Paid | Tax Assessment Tax Assessment Total Assessment is a certain percentage of the fair market value that is determined by local assessors to be the total taxable value of land and additions on the property. | Land | Improvement |
|---|---|---|---|---|
| 2024 | $3,652 | $134,120 | $28,800 | $105,320 |
| 2023 | $3,652 | $134,120 | $28,800 | $105,320 |
| 2022 | $3,182 | $113,280 | $26,800 | $86,480 |
| 2021 | $2,594 | $83,440 | $20,800 | $62,640 |
| 2020 | $2,348 | $71,200 | $14,160 | $57,040 |
| 2019 | $2,289 | $71,200 | $14,160 | $57,040 |
| 2018 | $2,288 | $71,200 | $14,160 | $57,040 |
| 2016 | $1,961 | $55,080 | $12,400 | $42,680 |
| 2015 | $1,971 | $55,080 | $12,400 | $42,680 |
| 2014 | $1,904 | $55,080 | $12,400 | $42,680 |
Source: Public Records
Map
Nearby Homes
- 1832 Shores Ridge Ct
- 2012 Little River Dr Unit 1
- 2135 Saint Thomas Way
- 2050 Fortuna St
- 1955 Watson Falls Ct
- 2167 Merrymount Dr
- 83 Russell Rd
- 1833 Riverton Dr NW
- 1932 Riverton Dr
- 81 Russell Rd
- 1870 Wildcat Trace Cir
- 12 Jacobs Farm Ln Unit 6
- 1930 Collins Hill Rd
- 260 Wildcat Lake Dr
- 401 Hambridge Ct
- 340 Rosedown Way
- 1931 Abinger Way
- 1960 Oak Village Ln
- 1961 Oak Village Ln Unit 2
- 1981 Oak Village Ln
- 1990 Oak Village Ln Unit 2
- 1971 Oak Village Ln
- 1950 Oak Village Ln
- 1991 Oak Village Ln
- 2000 Oak Village Ln
- 1951 Oak Village Ln
- 1940 Oak Village Ln
- 1961 Fernwood Dr
- 1951 Fernwood Dr
- 2010 Oak Village Ln Unit 2
- 1964 Tyler Trace
- 2001 Oak Village Ln
- 1941 Fernwood Dr
- 1974 Tyler Trace
- 0 Fernwood Dr Unit 7054884
- 0 Fernwood Dr Unit 8846475
- 0 Fernwood Dr Unit 8296789