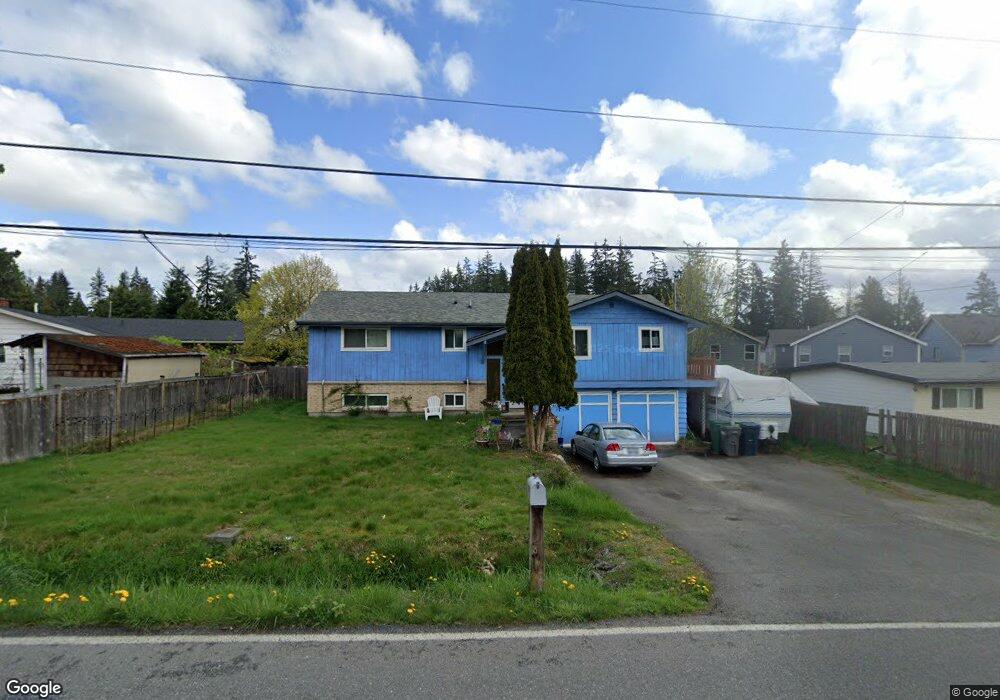
19703 Filbert Dr Bothell, WA 98012
Queensborough-Brentwood NeighborhoodEstimated Value: $783,000 - $972,000
3
Beds
2
Baths
2,088
Sq Ft
$412/Sq Ft
Est. Value
About This Home
This home is located at 19703 Filbert Dr, Bothell, WA 98012 and is currently estimated at $860,224, approximately $411 per square foot. 19703 Filbert Dr is a home located in Snohomish County with nearby schools including Frank Love Elementary School, Kenmore Middle School, and Bothell High School.
Ownership History
Date
Name
Owned For
Owner Type
Purchase Details
Closed on
Dec 23, 2002
Sold by
Greenberg Heath and Greenberg Diana
Bought by
Howards Jason R and Howards Jennifer E
Current Estimated Value
Home Financials for this Owner
Home Financials are based on the most recent Mortgage that was taken out on this home.
Original Mortgage
$232,800
Outstanding Balance
$97,261
Interest Rate
5.86%
Estimated Equity
$762,963
Purchase Details
Closed on
Aug 11, 1998
Sold by
Davis Michael J and Hubbell Cleadythe K
Bought by
Greenberg Heath and Greenberg Diana
Home Financials for this Owner
Home Financials are based on the most recent Mortgage that was taken out on this home.
Original Mortgage
$149,800
Interest Rate
9.62%
Purchase Details
Closed on
Oct 19, 1995
Sold by
Hubbell Orvis E and Hubbell Cleadythe K
Bought by
Hubbell Cleadythe K and Cleadythe K Hubbell Family Trust
Create a Home Valuation Report for This Property
The Home Valuation Report is an in-depth analysis detailing your home's value as well as a comparison with similar homes in the area
Home Values in the Area
Average Home Value in this Area
Purchase History
| Date | Buyer | Sale Price | Title Company |
|---|---|---|---|
| Howards Jason R | $240,000 | Chicago | |
| Greenberg Heath | $183,350 | Fidelity National Title | |
| Hubbell Cleadythe K | -- | Chicago Title Insurance Co |
Source: Public Records
Mortgage History
| Date | Status | Borrower | Loan Amount |
|---|---|---|---|
| Open | Howards Jason R | $232,800 | |
| Previous Owner | Greenberg Heath | $149,800 | |
| Closed | Greenberg Heath | $24,413 |
Source: Public Records
Tax History
| Year | Tax Paid | Tax Assessment Tax Assessment Total Assessment is a certain percentage of the fair market value that is determined by local assessors to be the total taxable value of land and additions on the property. | Land | Improvement |
|---|---|---|---|---|
| 2025 | $5,692 | $679,600 | $465,600 | $214,000 |
| 2024 | $5,692 | $662,900 | $455,900 | $207,000 |
| 2023 | $5,727 | $721,100 | $504,400 | $216,700 |
| 2022 | $5,334 | $538,700 | $354,100 | $184,600 |
| 2020 | $4,804 | $437,700 | $272,700 | $165,000 |
| 2019 | $4,273 | $392,200 | $232,800 | $159,400 |
| 2018 | $3,995 | $345,200 | $199,500 | $145,700 |
| 2017 | $3,453 | $300,300 | $166,300 | $134,000 |
| 2016 | $3,124 | $264,200 | $133,000 | $131,200 |
Source: Public Records
Map
Nearby Homes
- 19726 Filbert Dr
- 24 199th Place SE
- 19228 Meridian Dr SE Unit CW 10
- 603 194th Place SE
- 19221 Meridian Dr SE Unit CW 16
- 105 202nd St SE
- 19112 Meridian Dr SE Unit CW 01
- 19220 Meridian Dr SE Unit CW 08
- 727 198th Place SE
- 20029 7th Ave SE
- 429 203rd Place SE
- 525 192nd Place SE
- 19814 10th Dr SE
- 306 Poppy Rd
- 130 203rd Place SW
- 618 203rd St SE
- 303 Poppy Rd
- 820 Grimes Rd
- 20231 4th Place W
- 19921 10th Dr SE
- 19625 2nd Ave SE
- 19716 2nd Dr SE
- 19712 2nd Dr SE
- 19715 Filbert Dr
- 19724 2nd Dr SE
- 19704 2nd Dr SE
- 19705 2nd Dr SE
- 19615 2nd Ave SE
- 19632 2nd Dr SE
- 19632 2nd Dr SE
- 219 197th St SE
- 219 197th St SE
- 19711 2nd Dr SE
- 19628 2nd Dr SE
- 19804 2nd Dr SE
- 19804 2nd Dr SE
- 19600 2nd Ave SE
- 19721 1st Dr SE Unit 8
- 19707 2nd Dr SE
- 19725 2nd Dr SE
Your Personal Tour Guide
Ask me questions while you tour the home.