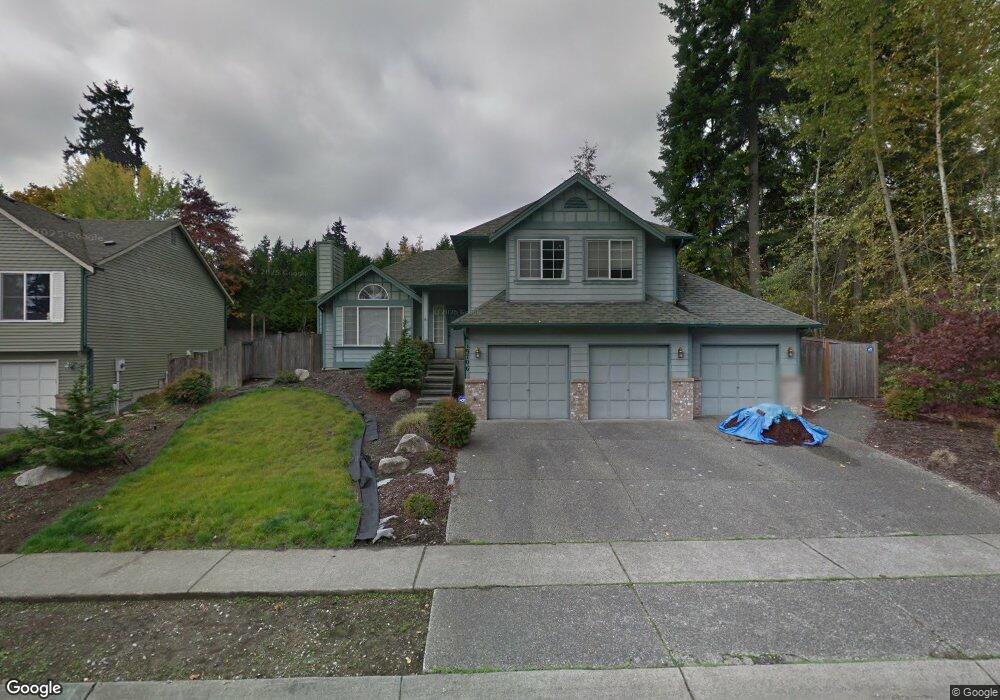
19706 10th Dr SE Bothell, WA 98012
Queensborough-Brentwood NeighborhoodEstimated Value: $918,000 - $1,021,000
3
Beds
3
Baths
1,910
Sq Ft
$505/Sq Ft
Est. Value
About This Home
This home is located at 19706 10th Dr SE, Bothell, WA 98012 and is currently estimated at $963,625, approximately $504 per square foot. 19706 10th Dr SE is a home located in Snohomish County with nearby schools including Crystal Springs Elementary School, Canyon Park Junior High School, and Bothell High School.
Ownership History
Date
Name
Owned For
Owner Type
Purchase Details
Closed on
Jul 20, 2010
Sold by
Ringstad Knee Deborah M and Knee Samuel C
Bought by
Ringstad Knee Deborah M
Current Estimated Value
Home Financials for this Owner
Home Financials are based on the most recent Mortgage that was taken out on this home.
Original Mortgage
$68,700
Interest Rate
4.34%
Mortgage Type
New Conventional
Purchase Details
Closed on
Jun 22, 2010
Sold by
Knee Samuel C and Ringstad Knee Debbie Marie
Bought by
Knee Samuel C and Ringstad Knee Debbie Marie
Home Financials for this Owner
Home Financials are based on the most recent Mortgage that was taken out on this home.
Original Mortgage
$68,700
Interest Rate
4.34%
Mortgage Type
New Conventional
Purchase Details
Closed on
Apr 11, 1996
Sold by
Crosby Homes Inc
Bought by
Knee Samuel C and Ringstad Debbie M
Home Financials for this Owner
Home Financials are based on the most recent Mortgage that was taken out on this home.
Original Mortgage
$169,950
Interest Rate
7.41%
Create a Home Valuation Report for This Property
The Home Valuation Report is an in-depth analysis detailing your home's value as well as a comparison with similar homes in the area
Home Values in the Area
Average Home Value in this Area
Purchase History
| Date | Buyer | Sale Price | Title Company |
|---|---|---|---|
| Ringstad Knee Deborah M | -- | None Available | |
| Knee Samuel C | -- | Chicago Title Servicelink Di | |
| Knee Samuel C | $179,950 | Chicago Title Insurance Co |
Source: Public Records
Mortgage History
| Date | Status | Borrower | Loan Amount |
|---|---|---|---|
| Closed | Knee Samuel C | $68,700 | |
| Closed | Knee Samuel C | $169,950 |
Source: Public Records
Tax History Compared to Growth
Tax History
| Year | Tax Paid | Tax Assessment Tax Assessment Total Assessment is a certain percentage of the fair market value that is determined by local assessors to be the total taxable value of land and additions on the property. | Land | Improvement |
|---|---|---|---|---|
| 2025 | $7,351 | $909,800 | $545,000 | $364,800 |
| 2024 | $7,351 | $877,600 | $525,000 | $352,600 |
| 2023 | $7,363 | $957,300 | $610,000 | $347,300 |
| 2022 | $6,344 | $659,000 | $366,000 | $293,000 |
| 2020 | $5,663 | $546,800 | $293,000 | $253,800 |
| 2019 | $4,924 | $486,600 | $240,000 | $246,600 |
| 2018 | $4,704 | $438,400 | $215,000 | $223,400 |
| 2017 | $3,856 | $368,400 | $178,000 | $190,400 |
| 2016 | $3,780 | $350,000 | $165,000 | $185,000 |
| 2015 | $3,747 | $326,700 | $152,000 | $174,700 |
| 2013 | $3,337 | $252,300 | $126,000 | $126,300 |
Source: Public Records
Map
Nearby Homes
- Design 2 Plan at Aberdour Landing
- Design 1 Plan at Aberdour Landing
- Design 3 Plan at Aberdour Landing
- The Huntington A Plan at Harvest Trails
- The Kingston Plan at Harvest Trails
- The Claremont B Plan at Harvest Trails
- The Regis Plan at Harvest Trails
- The Huntington B Plan at Harvest Trails
- 1322 194th St SE Unit B7
- 1322 194th St SE Unit E1
- 1322 194th St SE Unit D7
- 1322 194th St SE Unit D4
- 1322 194th St SE Unit B3
- 1322 194th St SE Unit D1
- 1322 194th St SE Unit B5
- 1322 194th St SE Unit D6
- 532 198th St SE
- 1332 192nd St SE Unit 50
- 20025 6th Dr SE
- 20029 7th Ave SE
- 19714 10th Dr SE
- 19720 10th Dr SE
- 19713 10th Dr SE
- 19705 10th Dr SE
- 19719 10th Dr SE
- 19701 10th Dr SE
- 1000 Duchess Rd
- 19629 10th Dr SE
- 19725 10th Dr SE
- 19724 11th Dr SE Unit Lot15
- 19724 11th Dr SE
- 19724 11th Dr SE Unit ARV15
- 19711 9th Dr SE
- 19705 9th Dr SE
- 102 196th St SE
- 1000 196th St SE
- 19721 9th Dr SE
- 19726 11th Dr SE Unit Lot16
- 19726 11th Dr SE Unit ARV16
- 19629 9th Dr SE