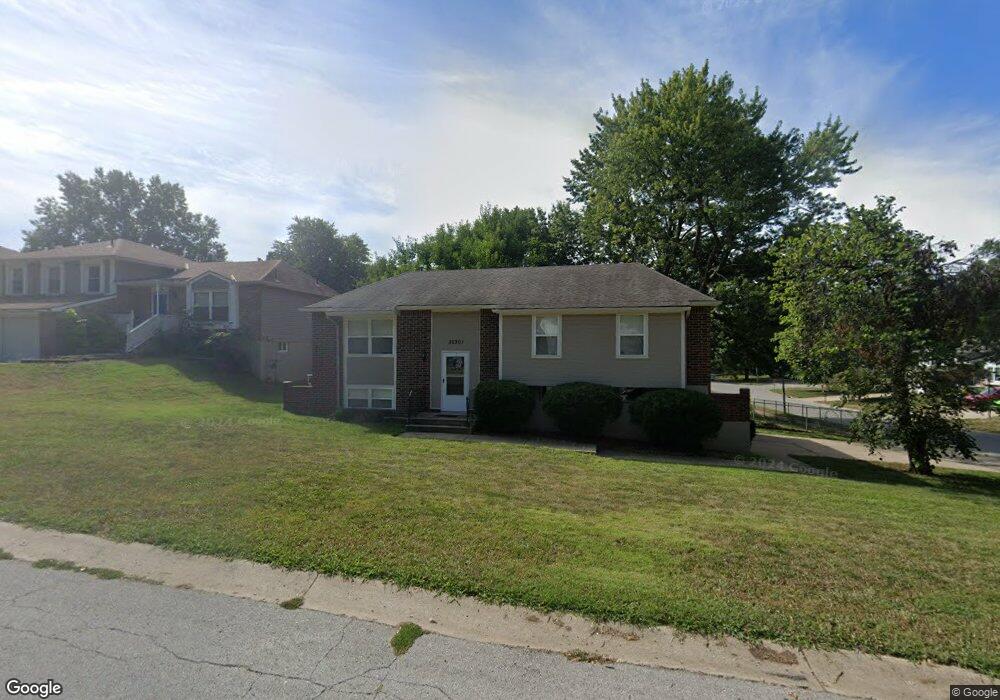
19709 E 17th Street Ct N Independence, MO 64056
Ripley NeighborhoodEstimated Value: $218,000 - $252,000
3
Beds
1
Bath
1,014
Sq Ft
$230/Sq Ft
Est. Value
About This Home
This home is located at 19709 E 17th Street Ct N, Independence, MO 64056 and is currently estimated at $232,950, approximately $229 per square foot. 19709 E 17th Street Ct N is a home located in Jackson County with nearby schools including Fort Osage High School.
Ownership History
Date
Name
Owned For
Owner Type
Purchase Details
Closed on
Mar 29, 1996
Sold by
Pinney Dean R
Bought by
Miller Kenneth D and Miller Kristina M
Current Estimated Value
Home Financials for this Owner
Home Financials are based on the most recent Mortgage that was taken out on this home.
Original Mortgage
$70,450
Outstanding Balance
$2,734
Interest Rate
6.92%
Mortgage Type
FHA
Estimated Equity
$230,216
Create a Home Valuation Report for This Property
The Home Valuation Report is an in-depth analysis detailing your home's value as well as a comparison with similar homes in the area
Home Values in the Area
Average Home Value in this Area
Purchase History
| Date | Buyer | Sale Price | Title Company |
|---|---|---|---|
| Miller Kenneth D | -- | -- |
Source: Public Records
Mortgage History
| Date | Status | Borrower | Loan Amount |
|---|---|---|---|
| Open | Miller Kenneth D | $70,450 |
Source: Public Records
Tax History Compared to Growth
Tax History
| Year | Tax Paid | Tax Assessment Tax Assessment Total Assessment is a certain percentage of the fair market value that is determined by local assessors to be the total taxable value of land and additions on the property. | Land | Improvement |
|---|---|---|---|---|
| 2025 | $2,852 | $29,148 | $5,398 | $23,750 |
| 2024 | $2,838 | $35,910 | $6,012 | $29,898 |
| 2023 | $2,838 | $35,910 | $4,843 | $31,067 |
| 2022 | $1,834 | $22,040 | $5,947 | $16,093 |
| 2021 | $1,833 | $22,040 | $5,947 | $16,093 |
| 2020 | $1,694 | $20,097 | $5,947 | $14,150 |
| 2019 | $1,678 | $20,097 | $5,947 | $14,150 |
| 2018 | $1,550 | $18,456 | $3,059 | $15,397 |
| 2017 | $1,385 | $18,456 | $3,059 | $15,397 |
| 2016 | $1,385 | $17,993 | $2,793 | $15,200 |
| 2014 | $1,271 | $16,431 | $2,780 | $13,651 |
Source: Public Records
Map
Nearby Homes
- 19713 E 17th Terrace N
- 1620 N Belvidere Ave
- 1705 N Jones Ct
- 19704 E 14th Terrace N
- 1304 N Holland Ct
- 1320 N Holland Ct
- 1328 N Holland Ct
- 1337 N Holland Ct
- 1345 N Holland Ct
- 19706 E 14th St N
- 20107 E Blue Mills Ct
- 19707 E 14th St N
- 1709 N Hanover Ave
- 20213 E 14th Terrace Ct N
- 19600 E 20th St N
- 20408 E 15th Terrace N
- 19706 E 20th St N
- 1349 N Holland Dr
- 19313 E 14th St N
- 1910 N York St
- 19705 E 17th Street Ct N
- 19713 E 17th Street Ct N
- 1616 N Glenview Ct
- 1612 N Glenview Ct
- 19701 E 17th Street Ct N
- 19801 E 17th Street Ct N
- 1621 N Glenview Ct
- 19700 E 17th Street Ct N
- 1613 N Glen Ellyn St
- 1617 N Glen Ellyn St
- 1621 N Glen Ellyn St
- 1625 N Glen Ellyn St
- 1608 N Glenview Ct
- 19805 E 17th Street Ct N
- 19700 E 17th Street Ct N
- 19700 E 17th Street Ct N
- 19704 E 17th Street Ct N
- 19708 E 17th Street Ct N
- 1609 N Glen Ellyn St
- 1629 N Glen Ellyn St