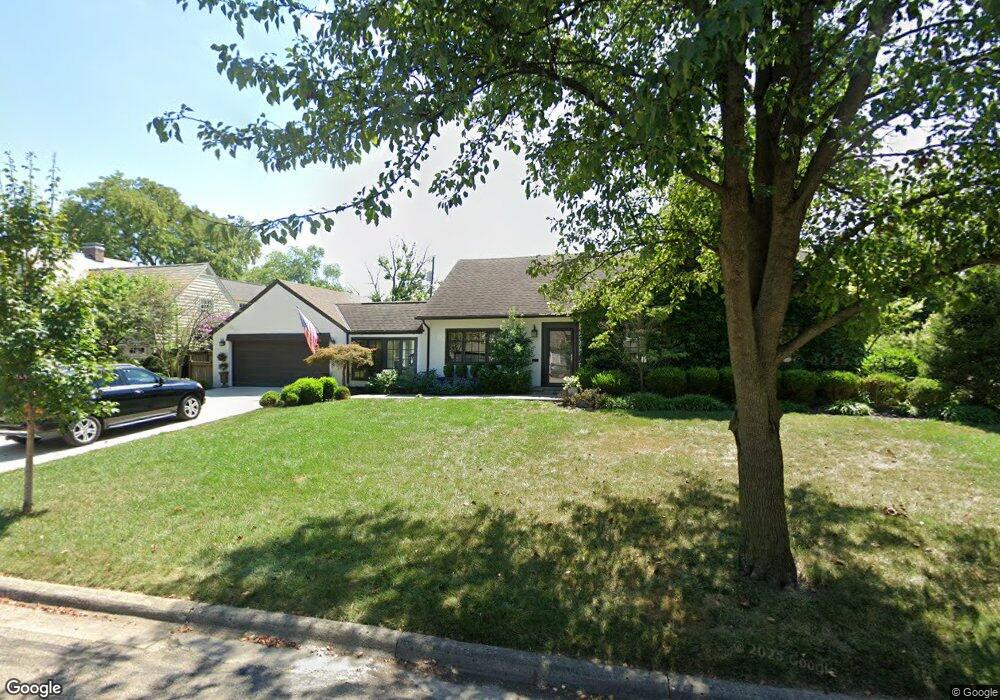
1971 Beverly Rd Columbus, OH 43221
Estimated Value: $823,204 - $958,000
3
Beds
2
Baths
2,567
Sq Ft
$341/Sq Ft
Est. Value
About This Home
This home is located at 1971 Beverly Rd, Columbus, OH 43221 and is currently estimated at $874,801, approximately $340 per square foot. 1971 Beverly Rd is a home located in Franklin County with nearby schools including Barrington Road Elementary School, Jones Middle School, and Upper Arlington High School.
Ownership History
Date
Name
Owned For
Owner Type
Purchase Details
Closed on
Oct 5, 2006
Sold by
Budzik Keith C and Budzik Karin M
Bought by
Budzik Keith C and Budzik Karin M
Current Estimated Value
Purchase Details
Closed on
May 27, 2001
Sold by
Sokol John S and Campbell Elizabeth M
Bought by
Campbell Sokol John Scott and Campbell Sokol Elizabeth
Home Financials for this Owner
Home Financials are based on the most recent Mortgage that was taken out on this home.
Original Mortgage
$200,000
Outstanding Balance
$69,106
Interest Rate
6.5%
Estimated Equity
$805,695
Purchase Details
Closed on
Nov 27, 1992
Purchase Details
Closed on
Sep 1, 1986
Create a Home Valuation Report for This Property
The Home Valuation Report is an in-depth analysis detailing your home's value as well as a comparison with similar homes in the area
Home Values in the Area
Average Home Value in this Area
Purchase History
| Date | Buyer | Sale Price | Title Company |
|---|---|---|---|
| Budzik Keith C | -- | None Available | |
| Campbell Sokol John Scott | -- | Hummel Title Agency Inc | |
| -- | $187,500 | -- | |
| -- | $125,000 | -- |
Source: Public Records
Mortgage History
| Date | Status | Borrower | Loan Amount |
|---|---|---|---|
| Open | Campbell Sokol John Scott | $200,000 |
Source: Public Records
Tax History
| Year | Tax Paid | Tax Assessment Tax Assessment Total Assessment is a certain percentage of the fair market value that is determined by local assessors to be the total taxable value of land and additions on the property. | Land | Improvement |
|---|---|---|---|---|
| 2025 | $14,267 | $242,830 | $126,140 | $116,690 |
| 2024 | $14,267 | $242,830 | $126,140 | $116,690 |
| 2023 | $13,884 | $242,830 | $126,140 | $116,690 |
| 2022 | $12,444 | $178,080 | $78,610 | $99,470 |
| 2021 | $11,016 | $178,080 | $78,610 | $99,470 |
| 2020 | $10,918 | $178,080 | $78,610 | $99,470 |
| 2019 | $11,208 | $161,630 | $78,610 | $83,020 |
| 2018 | $10,338 | $161,630 | $78,610 | $83,020 |
| 2017 | $10,331 | $161,630 | $78,610 | $83,020 |
| 2016 | $9,540 | $144,280 | $76,270 | $68,010 |
| 2015 | $9,531 | $144,280 | $76,270 | $68,010 |
| 2014 | $9,542 | $144,280 | $76,270 | $68,010 |
| 2013 | $4,556 | $131,145 | $69,335 | $61,810 |
Source: Public Records
Map
Nearby Homes
- 2208 Arlington Ave
- 1869 Tewksbury Rd
- 2151 Fairfax Rd
- 2165 S Parkway Dr
- 2583 Wexford Rd
- 1565 Berkshire Rd
- 2585 Westmont Blvd
- 1960 Hillside Dr
- 1508 Berkshire Rd
- 1940 Scioto Pointe Dr
- 2245 Riverside Dr Unit 309
- 1810 Ashland Ave
- 1876 Northwest Blvd Unit 2B
- 2329 Keep Place Unit 2329
- 2015 W 5th Ave Unit 211
- 2015 W 5th Ave Unit 102
- 2015 W 5th Ave Unit 108
- 1785 Northwest Ct Unit D
- 1631 Roxbury Rd Unit F3
- 1395 Upper Green Cir Unit 1395
- 2288 Coventry Rd
- 1957 Beverly Rd
- 2280 Coventry Rd
- 2312 Coventry Rd
- 1951 Beverly Rd
- 1946 Tewksbury Rd
- 1956 Tewksbury Rd
- 1945 Beverly Rd
- 1936 Tewksbury Rd
- 2324 Coventry Rd
- 1950 Beverly Rd
- 2305 Coventry Rd
- 2271 Coventry Rd
- 1995 Beverly Rd
- 1928 Tewksbury Rd
- 1946 Beverly Rd
- 1937 Beverly Rd
- 2000 Beverly Rd
- 1975 Wickford Rd
- 1986 Tewksbury Rd
Your Personal Tour Guide
Ask me questions while you tour the home.