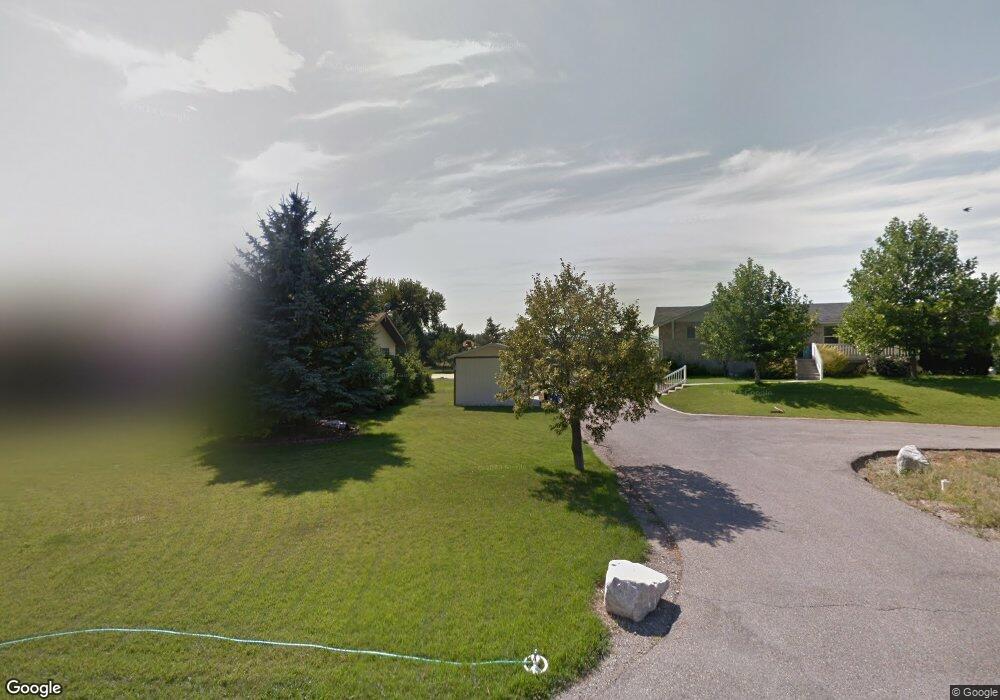
1971 E Main St Tremonton, UT 84337
Estimated Value: $479,000 - $527,000
4
Beds
3
Baths
2,650
Sq Ft
$186/Sq Ft
Est. Value
About This Home
This home is located at 1971 E Main St, Tremonton, UT 84337 and is currently estimated at $493,573, approximately $186 per square foot. 1971 E Main St is a home located in Box Elder County with nearby schools including North Park School, Bear River Middle School, and Alice C. Harris Intermediate School.
Ownership History
Date
Name
Owned For
Owner Type
Purchase Details
Closed on
Jun 8, 2010
Sold by
Woodworth Richard E and Woodworth Reta C
Bought by
Sorensen Layne C
Current Estimated Value
Home Financials for this Owner
Home Financials are based on the most recent Mortgage that was taken out on this home.
Original Mortgage
$144,060
Outstanding Balance
$97,866
Interest Rate
5.25%
Mortgage Type
FHA
Estimated Equity
$395,707
Create a Home Valuation Report for This Property
The Home Valuation Report is an in-depth analysis detailing your home's value as well as a comparison with similar homes in the area
Home Values in the Area
Average Home Value in this Area
Purchase History
| Date | Buyer | Sale Price | Title Company |
|---|---|---|---|
| Sorensen Layne C | -- | -- |
Source: Public Records
Mortgage History
| Date | Status | Borrower | Loan Amount |
|---|---|---|---|
| Open | Sorensen Layne C | $144,060 |
Source: Public Records
Tax History
| Year | Tax Paid | Tax Assessment Tax Assessment Total Assessment is a certain percentage of the fair market value that is determined by local assessors to be the total taxable value of land and additions on the property. | Land | Improvement |
|---|---|---|---|---|
| 2025 | $2,889 | $449,591 | $105,000 | $344,591 |
| 2024 | $2,574 | $445,731 | $105,000 | $340,731 |
| 2023 | $2,701 | $459,151 | $100,000 | $359,151 |
| 2022 | $2,540 | $246,342 | $16,500 | $229,842 |
| 2021 | $2,047 | $280,092 | $30,000 | $250,092 |
| 2020 | $1,818 | $280,092 | $30,000 | $250,092 |
| 2019 | $1,682 | $138,226 | $16,500 | $121,726 |
| 2018 | $1,301 | $97,610 | $16,500 | $81,110 |
| 2017 | $1,344 | $177,472 | $16,500 | $147,472 |
| 2016 | $1,322 | $93,747 | $16,500 | $77,247 |
| 2015 | $1,201 | $86,725 | $16,500 | $70,225 |
| 2014 | $1,201 | $83,381 | $16,500 | $66,881 |
| 2013 | -- | $84,738 | $17,179 | $67,559 |
Source: Public Records
Map
Nearby Homes
- 1720 E Main St Unit 502
- 1720 E Main St Unit 501
- 1720 E Main St Unit 403
- 1720 E Main St Unit 503
- 8321 W 10800 N Unit 35
- 4979 W 12000 N
- 408 N 775 E
- 1393 E 240 N Unit 53
- 635 E 240 N Unit 9
- 1320 E 1310 S
- 21 Amber Ave
- 1268 E 1310 S
- 1118 E 1310 S
- 10295 N Vista Ln
- 10283 N Vista Ln
- 477 E 1325 S
- 384 N 200 E
- 625 N 300 E
- 285 S 100 E
- 108 S 100 E
- 1969 E Main St
- 1975 E Main St
- 1975 E Main St Unit 2
- 1945 E Main St
- 1945 E Main St
- 1955 E Main St
- 1979 E Main St
- 1993 E Main St
- 1983 E Main St
- 1930 E Main St
- 1844 E Main St
- 2000 E Main St
- 1845 E Main St
- 1960 E Main St Unit LOG
- 1920 E Main St
- 2111 E Main St
- 1987 E Main St
- 1785 E Main St
- 2165 E Main St
- 2139 E Main St
Your Personal Tour Guide
Ask me questions while you tour the home.