
Landlord's Agent in 2024
Jeni Spagnoli
Pearson Smith Realty, LLC
(703) 597-5364
117 Total Sales

Estimated Value: $1,517,828 - $1,642,000
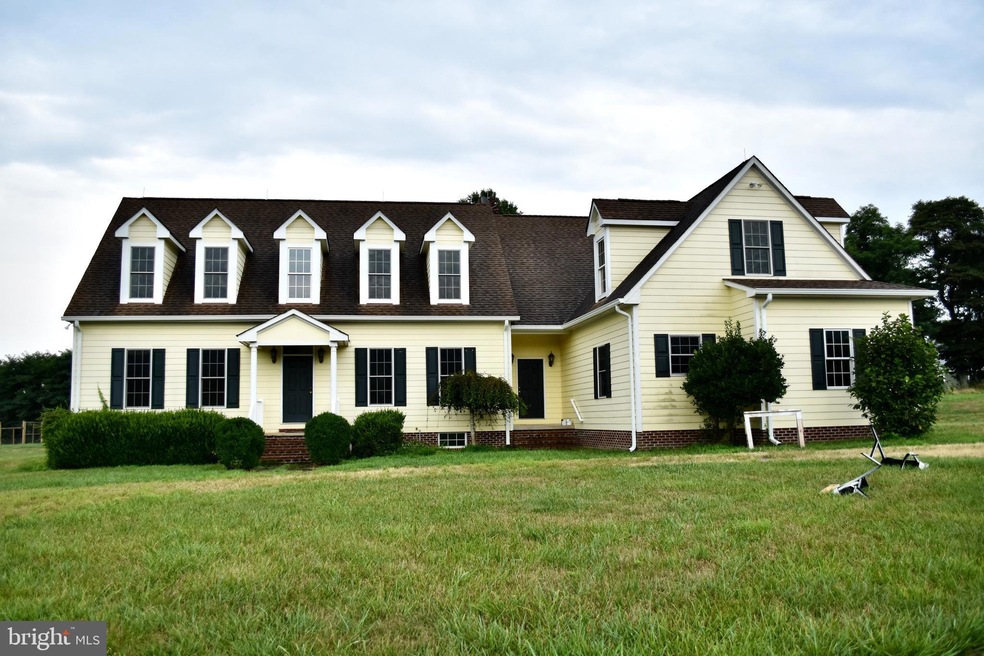
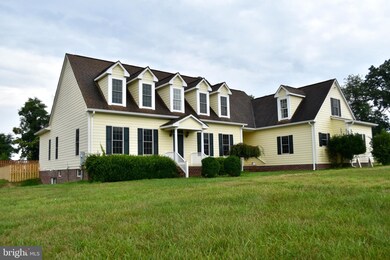
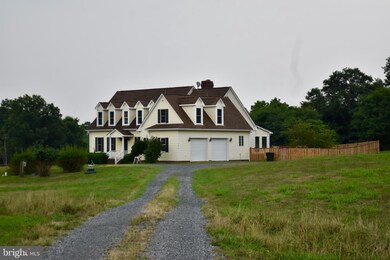
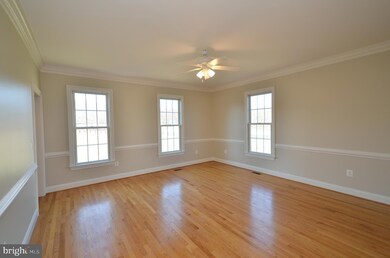
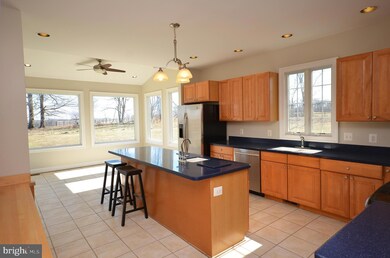
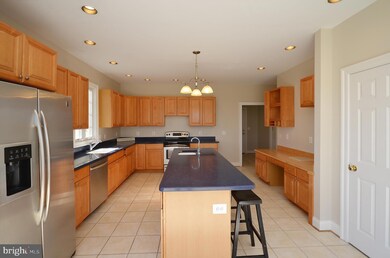
Detached home in the country ready for immediate occupancy. Upstairs has 3 large bedrooms, huge loft, another versatile room, and 3 full baths. Primary bedroom and bath are on the main level. Home shares 9 acres with breathtaking mountain views and pond nearby. Small farm animals considered. Pets considered on a case-by-case basis. Rear lawn is fenced. Lawn maintenance is included. Pool is optional at tenants sole expense and repair. Landlords would prefer for the unfinished basement not to be used, but one section can be used for storage. Fireplace is inoperable. All applicants must apply using the Pearson Smith online application. Landlord is seeking credit scores above 650 and minimum annual income of $126,000 to qualify.
Last Agent to Rent the Property
(703) 597-5364 HomeSalesByJeni@gmail.com Pearson Smith Realty, LLC License #673493 Listed on: 07/25/2024
| Date | Event | Price | List to Sale | Price per Sq Ft | Prior Sale |
|---|---|---|---|---|---|
| 08/08/2024 08/08/24 | Rented | $3,500 | 0.0% | -- | |
| 08/02/2024 08/02/24 | Under Contract | -- | -- | -- | |
| 07/25/2024 07/25/24 | For Rent | $3,500 | +2.9% | -- | |
| 09/08/2023 09/08/23 | Rented | $3,400 | 0.0% | -- | |
| 08/19/2023 08/19/23 | For Rent | $3,400 | 0.0% | -- | |
| 08/15/2021 08/15/21 | Rented | $3,400 | +3.0% | -- | |
| 08/10/2021 08/10/21 | Under Contract | -- | -- | -- | |
| 08/03/2021 08/03/21 | Off Market | $3,300 | -- | -- | |
| 07/23/2021 07/23/21 | For Rent | $3,300 | +6.5% | -- | |
| 06/01/2020 06/01/20 | Rented | $3,100 | +3.3% | -- | |
| 05/24/2020 05/24/20 | Under Contract | -- | -- | -- | |
| 05/23/2020 05/23/20 | For Rent | $3,000 | +15.4% | -- | |
| 03/17/2019 03/17/19 | Rented | $2,600 | 0.0% | -- | |
| 03/15/2019 03/15/19 | Under Contract | -- | -- | -- | |
| 03/01/2019 03/01/19 | For Rent | $2,600 | 0.0% | -- | |
| 11/02/2018 11/02/18 | Sold | $915,000 | -3.7% | $207 / Sq Ft | View Prior Sale |
| 09/03/2018 09/03/18 | For Sale | $950,000 | -- | $214 / Sq Ft |
| Year | Tax Paid | Tax Assessment Tax Assessment Total Assessment is a certain percentage of the fair market value that is determined by local assessors to be the total taxable value of land and additions on the property. | Land | Improvement |
|---|---|---|---|---|
| 2025 | $11,716 | $1,455,440 | $363,200 | $1,092,240 |
| 2024 | $11,913 | $1,377,260 | $304,900 | $1,072,360 |
| 2023 | $11,289 | $1,290,160 | $289,900 | $1,000,260 |
| 2022 | $9,288 | $1,043,570 | $149,700 | $893,870 |
| 2021 | $8,884 | $1,007,090 | $229,900 | $777,190 |
| 2020 | $8,911 | $961,040 | $229,900 | $731,140 |
| 2019 | $8,561 | $920,650 | $229,900 | $690,750 |
| 2018 | $7,837 | $823,660 | $229,900 | $593,760 |
| 2017 | $7,744 | $790,450 | $229,900 | $560,550 |
| 2016 | $8,105 | $707,900 | $0 | $0 |
| 2015 | $7,724 | $680,490 | $127,760 | $552,730 |
| 2014 | $7,805 | $675,740 | $106,720 | $569,020 |
Landlord's Agent in 2024
Jeni Spagnoli
Pearson Smith Realty, LLC
(703) 597-5364
117 Total Sales
L
Tenant's Agent in 2024
Luke Preletz
Pearson Smith Realty, LLC
(703) 786-2872
14 Total Sales
L
Buyer's Agent in 2023
Leona Nutter
Coldwell Banker (NRT-Southeast-MidAtlantic)
(703) 727-4452
6 Total Sales
Buyer's Agent in 2021
Mary Chatfield-Taylor
Thomas and Talbot Estate Properties, Inc.
(540) 454-6500
5 Total Sales
Buyer's Agent in 2020
Sue Smith
Compass
(703) 928-7860
4 in this area
195 Total Sales
Buyer's Agent in 2019
Wesley Smith
Pearson Smith Realty, LLC
(571) 465-7649
63 Total Sales
Source: Bright MLS
MLS Number: VALO2076482
APN: 636-45-4210
Disclaimer: Certain information contained herein is derived from information provided by parties other than Homes.com. All information provided is deemed reliable, but is not guaranteed to be accurate and should be independently verified.
![]() The data relating to real estate for sale on this website appears in part through the BRIGHT Internet Data Exchange program, a voluntary cooperative exchange of property listing data between licensed real estate brokerage firms, and is provided by BRIGHT through a licensing agreement.
The data relating to real estate for sale on this website appears in part through the BRIGHT Internet Data Exchange program, a voluntary cooperative exchange of property listing data between licensed real estate brokerage firms, and is provided by BRIGHT through a licensing agreement.
Listing information is from various brokers who participate in the Bright MLS IDX program and not all listings may be visible on the site.
The property information being provided on or through the website is for the personal, non-commercial use of consumers and such information may not be used for any purpose other than to identify prospective properties consumers may be interested in purchasing.
Some properties which appear for sale on the website may no longer be available because they are for instance, under contract, sold or are no longer being offered for sale.
Property information displayed is deemed reliable but is not guaranteed.
Copyright 2025 Bright MLS, Inc.