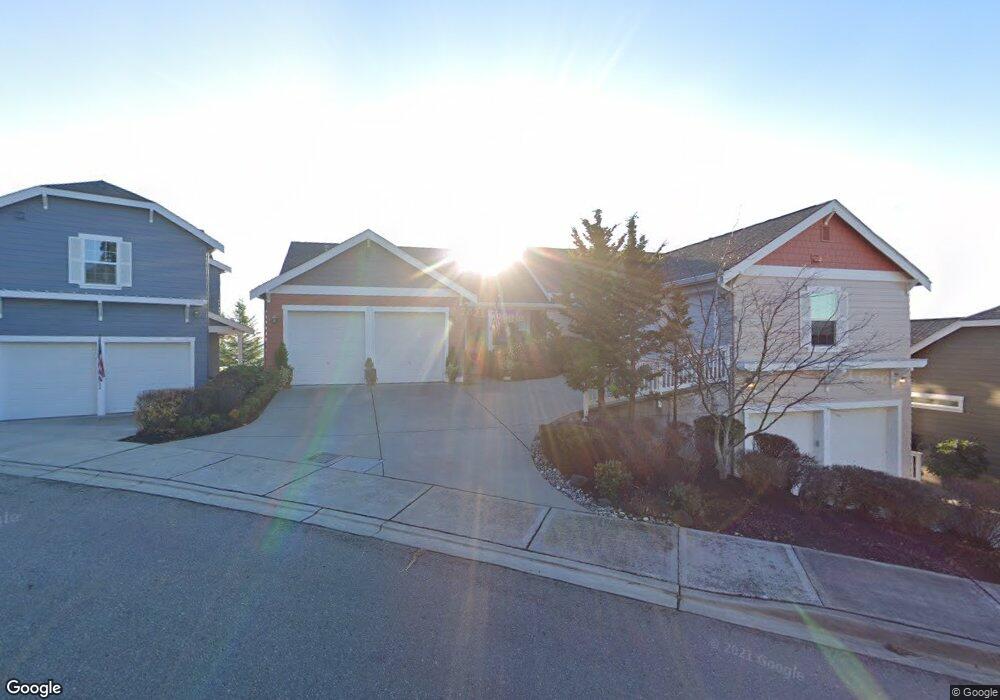
19713 NE Arbutus Ct Unit 100 Poulsbo, WA 98370
Estimated Value: $442,000 - $565,000
2
Beds
2
Baths
924
Sq Ft
$559/Sq Ft
Est. Value
About This Home
This home is located at 19713 NE Arbutus Ct Unit 100, Poulsbo, WA 98370 and is currently estimated at $516,537, approximately $559 per square foot. 19713 NE Arbutus Ct Unit 100 is a home located in Kitsap County with nearby schools including Poulsbo Elementary School, Poulsbo Middle School, and North Kitsap High School.
Ownership History
Date
Name
Owned For
Owner Type
Purchase Details
Closed on
Oct 26, 2010
Sold by
Berg Cyrus E
Bought by
Corbley Amy J and Corbley Kenneth
Current Estimated Value
Purchase Details
Closed on
Sep 23, 2009
Sold by
Berg Cyrus E
Bought by
Berg Cyrus E and Cyrus E Berg Trust Agreement
Purchase Details
Closed on
Nov 13, 2007
Sold by
Haight James J and Haight Karen M
Bought by
Berg Cyrus E and Berg Family Trust
Home Financials for this Owner
Home Financials are based on the most recent Mortgage that was taken out on this home.
Original Mortgage
$216,000
Interest Rate
5.87%
Mortgage Type
Purchase Money Mortgage
Purchase Details
Closed on
May 3, 2005
Sold by
Sp Poulsbo Gp I Inc
Bought by
Haight James J and Haight Karen M
Home Financials for this Owner
Home Financials are based on the most recent Mortgage that was taken out on this home.
Original Mortgage
$191,600
Interest Rate
5.84%
Mortgage Type
Fannie Mae Freddie Mac
Create a Home Valuation Report for This Property
The Home Valuation Report is an in-depth analysis detailing your home's value as well as a comparison with similar homes in the area
Home Values in the Area
Average Home Value in this Area
Purchase History
| Date | Buyer | Sale Price | Title Company |
|---|---|---|---|
| Corbley Amy J | $200,280 | Stewart Title Kitsap County | |
| Berg Cyrus E | -- | None Available | |
| Berg Cyrus E | $270,280 | Transnation Title Ins Co | |
| Haight James J | $239,500 | Pacific Nw Title |
Source: Public Records
Mortgage History
| Date | Status | Borrower | Loan Amount |
|---|---|---|---|
| Previous Owner | Berg Cyrus E | $216,000 | |
| Previous Owner | Haight James J | $191,600 |
Source: Public Records
Tax History Compared to Growth
Tax History
| Year | Tax Paid | Tax Assessment Tax Assessment Total Assessment is a certain percentage of the fair market value that is determined by local assessors to be the total taxable value of land and additions on the property. | Land | Improvement |
|---|---|---|---|---|
| 2026 | $4,884 | $544,280 | $211,570 | $332,710 |
| 2025 | $4,884 | $544,280 | $211,570 | $332,710 |
| 2024 | $3,992 | $457,990 | $171,460 | $286,530 |
| 2023 | $4,060 | $457,990 | $171,460 | $286,530 |
| 2022 | $3,623 | $388,650 | $148,830 | $239,820 |
| 2021 | $3,503 | $348,260 | $133,360 | $214,900 |
| 2020 | $3,271 | $319,430 | $127,400 | $192,030 |
| 2019 | $3,067 | $299,460 | $119,070 | $180,390 |
| 2018 | $2,522 | $210,040 | $87,930 | $122,110 |
| 2017 | $2,415 | $210,040 | $87,930 | $122,110 |
| 2016 | $2,520 | $201,960 | $87,930 | $114,030 |
| 2015 | $2,457 | $197,910 | $87,930 | $109,980 |
| 2014 | -- | $203,280 | $0 | $203,280 |
| 2013 | -- | $203,280 | $0 | $203,280 |
Source: Public Records
Map
Nearby Homes
- 19795 4th Ave NE
- 19554 Jensen Way NE
- 19809 Ash Crest Loop NE
- 19463 Scoter Ln NE
- 20065 Regin Ct NE
- 20050 Vikings Crest Loop NE Unit 2-301
- 19531 Front St NE
- 32 NE Sunset St
- 123 NE Whimbrel Ln
- 20145 Vikings Crest Loop NE Unit 3-204
- 20249 State Highway 305 NE
- 600 NE Lincoln Rd Unit 41
- 17602 NE Midnight Sun Loop
- 0 7th Ave NE Unit NWM2280996
- 21601 Viking Ave NW
- 21133 Viking Ave NW
- 493 NE Lincoln Rd
- 18785 Ness Place NE
- 1257 Cameo Ct NE
- 18637 Fjord Dr NE
- 19713 NE Arbutus Ct Unit 200
- 19777 NE Arbutus Ct Unit 146
- 19755 NE Arbutus Ct
- 19779 NE Arbutus Ct Unit 100
- 19779 NE Arbutus Ct Unit 200
- 19779 NE Arbutus Ct Unit 145B
- 19779 NE Arbutus Ct Unit 145A
- 19797 NE Arbutus Ct Unit 144
- 19757 NE Arbutus Ct Unit 147A
- 19757 NE Arbutus Ct Unit 100
- 19797 4th Ave NE
- 19799 4th Ave NE
- 19799 NE Arbutus Ct Unit 200
- 19799 NE Arbutus Ct Unit 143B
- 19799 NE Arbutus Ct
- 19799 NE Arbutus Ct Unit 100
- 19793 4th Ave NE
- 19801 4th Ave NE
- 19803 4th Ave NE
- 19735 NE Arbutus Ct Unit 200