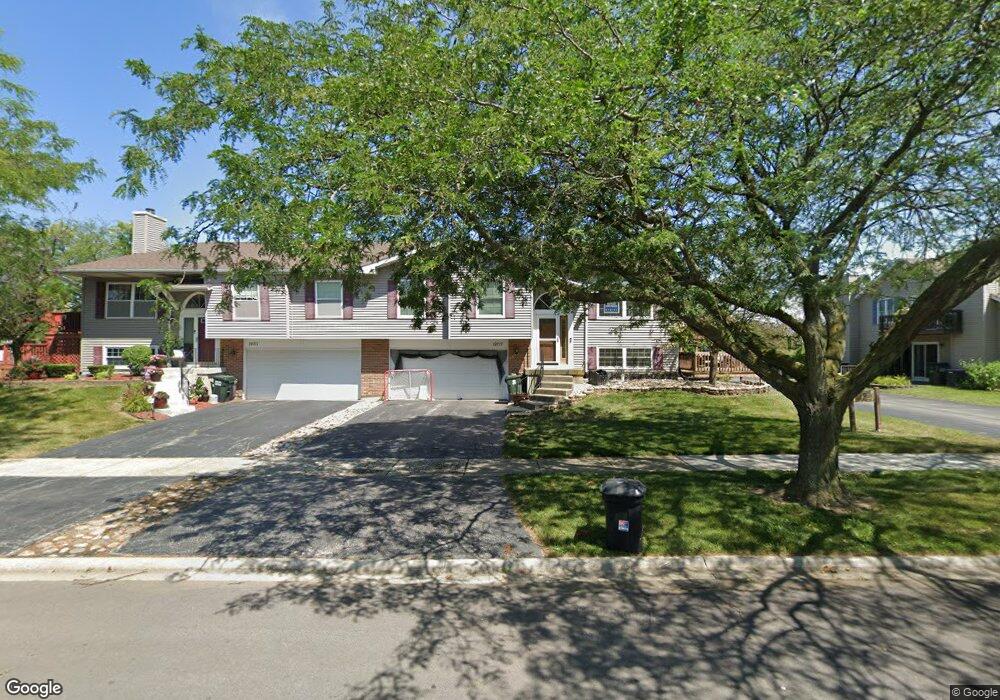
19715 S Edinburgh Ln Unit 7 Frankfort, IL 60423
Frankfort Square NeighborhoodEstimated Value: $253,000 - $282,000
3
Beds
2
Baths
1,614
Sq Ft
$167/Sq Ft
Est. Value
About This Home
This home is located at 19715 S Edinburgh Ln Unit 7, Frankfort, IL 60423 and is currently estimated at $269,189, approximately $166 per square foot. 19715 S Edinburgh Ln Unit 7 is a home located in Will County with nearby schools including Frankfort Square Elementary School, Summit Hill Junior High School, and Lincoln-Way East High School.
Ownership History
Date
Name
Owned For
Owner Type
Purchase Details
Closed on
Jul 28, 2017
Sold by
Clifton Christopher M and Clifton Michelle R
Bought by
Schwim Group Llc
Current Estimated Value
Home Financials for this Owner
Home Financials are based on the most recent Mortgage that was taken out on this home.
Interest Rate
3.92%
Purchase Details
Closed on
May 31, 2007
Sold by
Sajewski John E and Sulo Kimberly M
Bought by
Sajewski John E and Sajewski Kimberly M
Purchase Details
Closed on
Mar 29, 1994
Sold by
Brouwers Jon D and Bol Tricia L
Bought by
Sajewski John E and Sulo Kimberly M
Home Financials for this Owner
Home Financials are based on the most recent Mortgage that was taken out on this home.
Original Mortgage
$117,325
Interest Rate
6.75%
Create a Home Valuation Report for This Property
The Home Valuation Report is an in-depth analysis detailing your home's value as well as a comparison with similar homes in the area
Home Values in the Area
Average Home Value in this Area
Purchase History
| Date | Buyer | Sale Price | Title Company |
|---|---|---|---|
| Schwim Group Llc | -- | -- | |
| Sajewski John E | -- | Ticor Title | |
| Sajewski John E | $123,500 | -- |
Source: Public Records
Mortgage History
| Date | Status | Borrower | Loan Amount |
|---|---|---|---|
| Closed | Schwim Group Llc | -- | |
| Previous Owner | Sajewski John E | $117,325 |
Source: Public Records
Tax History Compared to Growth
Tax History
| Year | Tax Paid | Tax Assessment Tax Assessment Total Assessment is a certain percentage of the fair market value that is determined by local assessors to be the total taxable value of land and additions on the property. | Land | Improvement |
|---|---|---|---|---|
| 2024 | $6,062 | $79,868 | $780 | $79,088 |
| 2023 | $6,062 | $71,330 | $697 | $70,633 |
| 2022 | $5,384 | $64,970 | $635 | $64,335 |
| 2021 | $5,033 | $60,782 | $594 | $60,188 |
| 2020 | $4,948 | $59,069 | $577 | $58,492 |
| 2019 | $4,777 | $57,489 | $562 | $56,927 |
| 2018 | $4,595 | $55,836 | $546 | $55,290 |
| 2017 | $4,492 | $54,532 | $533 | $53,999 |
| 2016 | $4,345 | $52,663 | $515 | $52,148 |
| 2015 | $4,111 | $50,809 | $497 | $50,312 |
| 2014 | $4,111 | $50,456 | $494 | $49,962 |
| 2013 | $4,111 | $51,658 | $1,986 | $49,672 |
Source: Public Records
Map
Nearby Homes
- 19642 S Edinburgh Ln
- 19708 S Skye Dr
- 19558 S Harlem Ave
- 7407 Ridgefield Ln
- 56 Iliad Dr
- 20130 S Frankfort Square Rd
- 20206 S Frankfort Square Rd Unit A
- 20137 S Hampton Ct Unit A
- 7758 W Kingston Dr
- 7800 W Kingston Dr
- 20347 S Grand Prairie Ln
- 20349 S Green Meadow Ln
- 7752 W Almond Ct Unit 135
- 20027 S Jessica Ln
- 7639 W Juniper Ct
- 20513 S Acorn Ridge Dr
- 88 Odyssey Dr
- 7905 Richardson Ln
- 40 Corinth Dr
- 14 Corinth Ct
- 19715 S Edinburgh Ln Unit ADDRESS
- 19715 S Edinburgh Ln Unit 1983
- 19717 S Edinburgh Ln Unit 8
- 19713 S Edinburgh Ln Unit 6
- 19711 S Edinburgh Ln Unit 5
- 7259 W Benton Dr
- 19723 S Edinburgh Ln Unit 4
- 19721 S Edinburgh Ln Unit 1
- LOT Edinburgh Ct
- LOT 25 Edinburgh Ct
- LOT 24 Edinburgh Ct
- 7261 W Benton Dr Unit 4
- 19725 S Edinburgh Ln Unit 3
- 19725 S Edinburgh Ln Unit 1972
- 19705 S Edinburgh Ln Unit 3
- 19727 S Edinburgh Ln Unit 2
- 19733 S Edinburgh Ln Unit 3
- 19737 S Edinburgh Ln Unit 1
- 19728 S Edinburgh Ln
- 19735 S Edinburgh Ln Unit 4