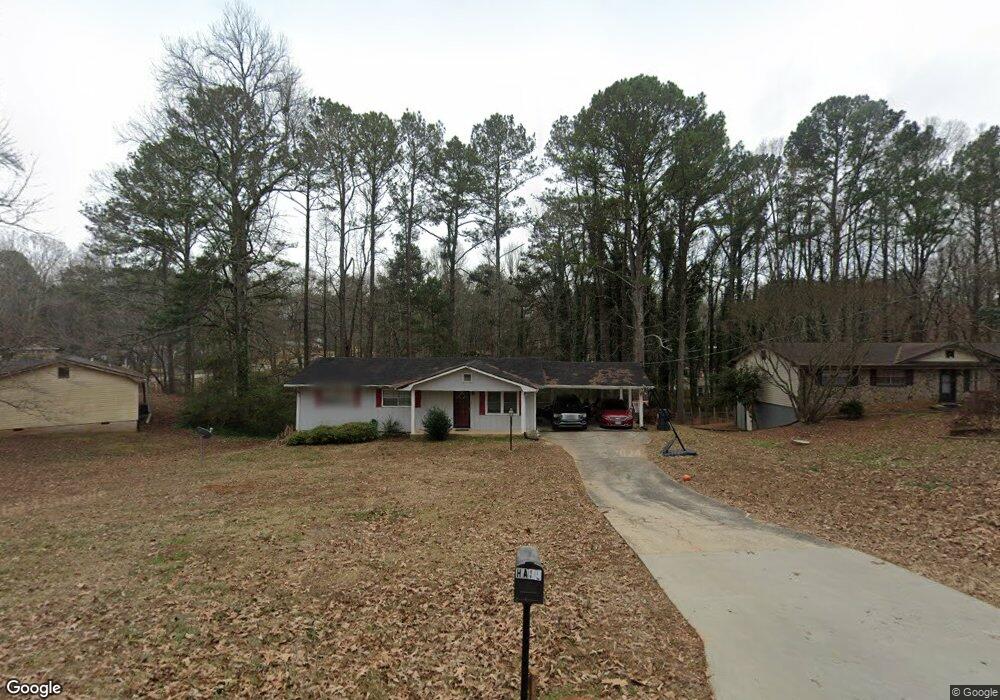
1972 Chestnut Log Dr Lithia Springs, GA 30122
Lithia Springs NeighborhoodEstimated Value: $185,000 - $229,000
3
Beds
2
Baths
1,056
Sq Ft
$196/Sq Ft
Est. Value
About This Home
This home is located at 1972 Chestnut Log Dr, Lithia Springs, GA 30122 and is currently estimated at $207,431, approximately $196 per square foot. 1972 Chestnut Log Dr is a home located in Douglas County with nearby schools including Sweetwater Elementary School, Factory Shoals Middle School, and Lithia Springs Comprehensive High School.
Ownership History
Date
Name
Owned For
Owner Type
Purchase Details
Closed on
Feb 16, 2015
Sold by
Shanks Richard A
Bought by
Shanks James
Current Estimated Value
Create a Home Valuation Report for This Property
The Home Valuation Report is an in-depth analysis detailing your home's value as well as a comparison with similar homes in the area
Home Values in the Area
Average Home Value in this Area
Purchase History
| Date | Buyer | Sale Price | Title Company |
|---|---|---|---|
| Shanks James | -- | -- |
Source: Public Records
Tax History Compared to Growth
Tax History
| Year | Tax Paid | Tax Assessment Tax Assessment Total Assessment is a certain percentage of the fair market value that is determined by local assessors to be the total taxable value of land and additions on the property. | Land | Improvement |
|---|---|---|---|---|
| 2024 | $2,215 | $70,400 | $18,000 | $52,400 |
| 2023 | $2,215 | $70,400 | $18,000 | $52,400 |
| 2022 | $1,692 | $51,960 | $18,000 | $33,960 |
| 2021 | $1,252 | $38,400 | $12,000 | $26,400 |
| 2020 | $1,273 | $38,400 | $12,000 | $26,400 |
| 2019 | $891 | $28,760 | $9,240 | $19,520 |
| 2018 | $764 | $24,560 | $8,040 | $16,520 |
| 2017 | $710 | $22,392 | $8,040 | $14,352 |
| 2016 | $845 | $26,200 | $9,600 | $16,600 |
| 2015 | $727 | $22,556 | $8,520 | $14,036 |
| 2014 | $727 | $21,644 | $8,640 | $13,004 |
| 2013 | -- | $24,080 | $9,600 | $14,480 |
Source: Public Records
Map
Nearby Homes
- 2087 Chestnut Way
- 2275 Chestnut Log Loop
- 2322 Chestnut Log Loop
- 2344 Mount Vernon Rd
- 1940 Lee
- 2182 Ann Ln
- 1815 Lee Rd
- 2499 Chestnut Log Loop
- 3570 Briar Dr
- 8684 Hickory Ln
- 2436 Falls River Dr
- LOT 27 Chestnut Ln
- 3646 Briar Dr
- 3460 Meadowview Dr
- 3652 Sweetbriar Cir
- 3686 Sweetbriar Cir
- 3790 Sweetbriar Cir
- 3552 Meadowview Dr
- 2435 Arlington Ct
- HAYDEN Plan at Fairhaven
- 1960 Chestnut Log Dr
- 1996 Chestnut Log Dr
- 2020 Chestnut Log Dr Unit 3
- 2096 Chestnut Cir
- 2098 Chestnut Cir Unit 3
- 2098 Chestnut Cir
- 1975 Chestnut Log Dr
- 1950 Chestnut Log Dr
- 1950 Chestnut Log Dr Unit 92
- 2108 Chestnut Cir
- 1985 Chestnut Log Dr
- 2030 Chestnut Log Dr Unit 3
- 1965 Chestnut Log Dr
- 2118 Chestnut Cir
- 1955 Chestnut Log Dr Unit 3
- 1955 Chestnut Log Dr
- 2017 Chestnut Log Dr
- 2017 Chestnut Log Dr Unit 3
- 1946 Chestnut Log Dr
- 1945 Chestnut Log Dr