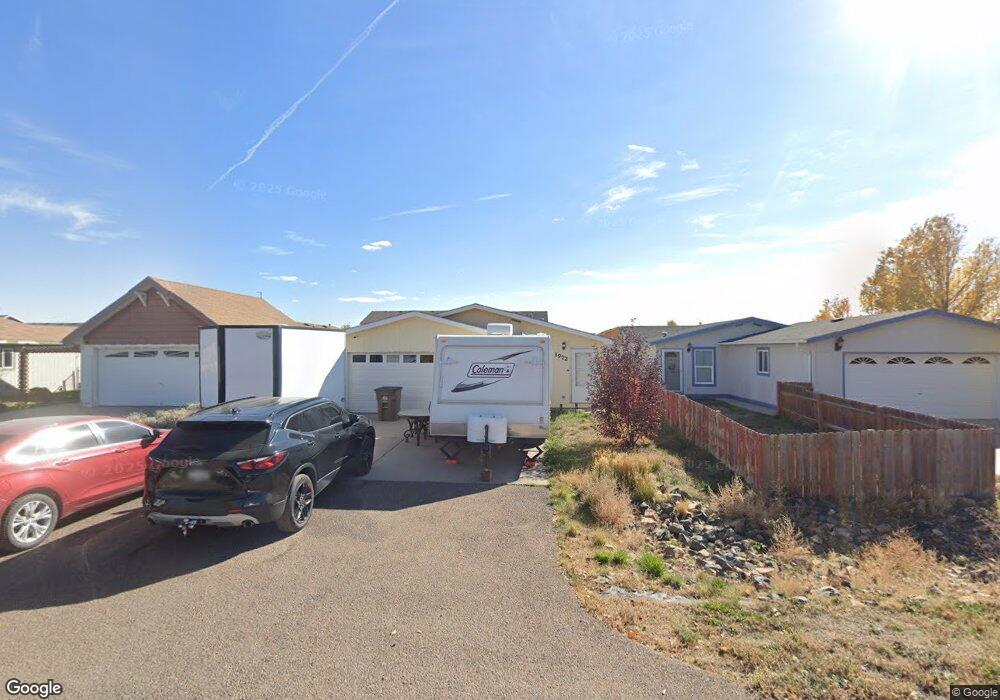
1972 Franklin St Laramie, WY 82070
Estimated Value: $296,000
3
Beds
2
Baths
1,293
Sq Ft
$229/Sq Ft
Est. Value
About This Home
This home is located at 1972 Franklin St, Laramie, WY 82070 and is currently estimated at $296,000, approximately $228 per square foot. 1972 Franklin St is a home located in Albany County with nearby schools including Velma Linford Elementary School, Laramie Middle School, and Laramie High School.
Ownership History
Date
Name
Owned For
Owner Type
Purchase Details
Closed on
Feb 25, 2022
Sold by
Jean Maggio Abby
Bought by
Fife Jeffrey
Current Estimated Value
Home Financials for this Owner
Home Financials are based on the most recent Mortgage that was taken out on this home.
Original Mortgage
$228,000
Outstanding Balance
$212,118
Interest Rate
3.55%
Mortgage Type
New Conventional
Estimated Equity
$83,882
Purchase Details
Closed on
Apr 11, 2014
Sold by
Stevens Deborah L
Bought by
Magglo Abby Jean and Martinez Kayla Marie
Home Financials for this Owner
Home Financials are based on the most recent Mortgage that was taken out on this home.
Original Mortgage
$147,283
Interest Rate
3.75%
Mortgage Type
FHA
Purchase Details
Closed on
Jul 21, 2005
Sold by
Brook Jennifer and Brook George W
Bought by
Stevens Deborah L
Home Financials for this Owner
Home Financials are based on the most recent Mortgage that was taken out on this home.
Original Mortgage
$141,501
Interest Rate
5.58%
Mortgage Type
FHA
Create a Home Valuation Report for This Property
The Home Valuation Report is an in-depth analysis detailing your home's value as well as a comparison with similar homes in the area
Home Values in the Area
Average Home Value in this Area
Purchase History
| Date | Buyer | Sale Price | Title Company |
|---|---|---|---|
| Fife Jeffrey | -- | First American Title | |
| Magglo Abby Jean | -- | None Available | |
| Stevens Deborah L | -- | -- |
Source: Public Records
Mortgage History
| Date | Status | Borrower | Loan Amount |
|---|---|---|---|
| Open | Fife Jeffrey | $228,000 | |
| Previous Owner | Magglo Abby Jean | $147,283 | |
| Previous Owner | Stevens Deborah L | $141,501 |
Source: Public Records
Tax History Compared to Growth
Tax History
| Year | Tax Paid | Tax Assessment Tax Assessment Total Assessment is a certain percentage of the fair market value that is determined by local assessors to be the total taxable value of land and additions on the property. | Land | Improvement |
|---|---|---|---|---|
| 2021 | $1,314 | $18,003 | $4,318 | $13,685 |
| 2020 | $1,223 | $16,754 | $3,883 | $12,871 |
| 2019 | $1,253 | $17,158 | $3,883 | $13,275 |
| 2018 | $1,141 | $15,632 | $3,194 | $12,438 |
| 2017 | $1,118 | $15,320 | $3,194 | $12,126 |
| 2016 | $1,049 | $14,366 | $2,386 | $11,980 |
| 2015 | $1,008 | $13,812 | $3,430 | $10,382 |
| 2014 | $1,037 | $14,208 | $0 | $0 |
Source: Public Records
Map
Nearby Homes
- 627 S Colorado Ave
- 1965 Truman St
- 1990 Truman St
- 541 S Johnson St
- 1866 Truman St
- 529 S Pierce St
- 2260 Franklin St Unit 27
- 2260 Franklin St Unit 38
- 1416 S Colorado Ave
- 1414 S Colorado Ave
- 1412 S Colorado Ave
- 1410 S Colorado Ave
- 370 S Buchanan St
- 427 S Pierce St
- 509 S Hayes St
- 2073 Monroe St
- 2075 Jefferson St
- 2166 W Wyoming Ave Unit 29
- 2166 W Wyoming Ave Unit 25
- 1886 Riverside Dr
- 1976 Franklin St
- 1968 Franklin St
- 1964 Franklin St
- 621 S Lincoln St
- 1960 Franklin St
- 1956 Franklin St
- 1961 Truman St
- 1961 Franklin St
- 1952 Franklin St
- 624 S Lincoln St
- 1957 Truman St
- 546 S Buchanan St
- 539 S Lincoln St
- 1882 Franklin St
- 2058 Franklin St
- 540 S Lincoln St Unit A
- 540 S Lincoln St Unit C
- 540 S Lincoln St Unit D
- 540 S Lincoln St Unit 3
- 540 S Lincoln St Unit F