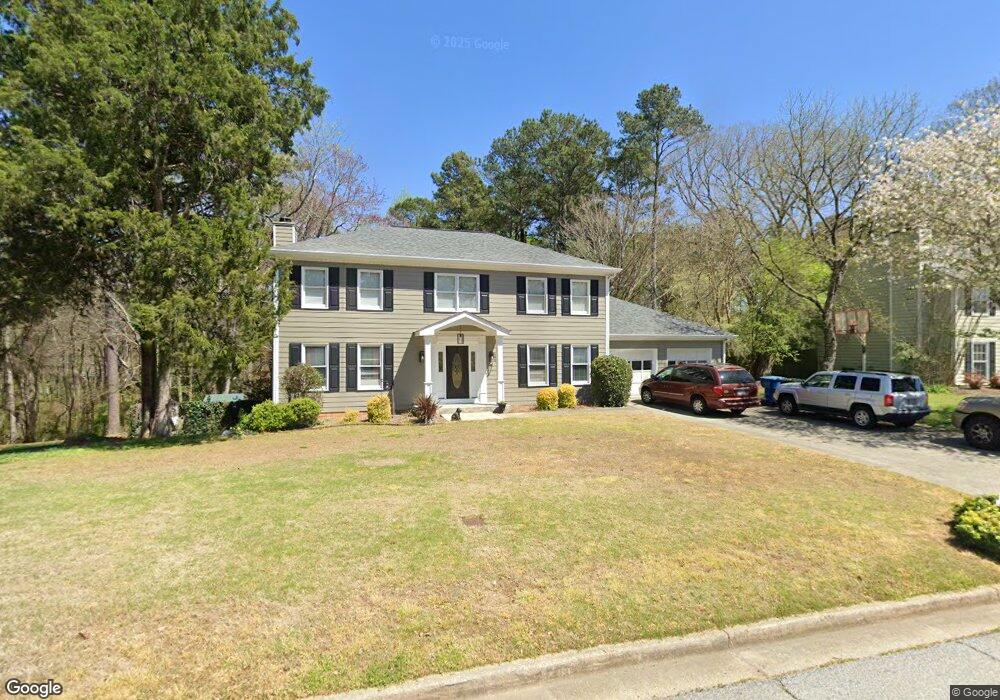
1972 Graystone Pkwy Unit 3 Grayson, GA 30017
Estimated Value: $392,024 - $413,000
4
Beds
2
Baths
2,548
Sq Ft
$156/Sq Ft
Est. Value
About This Home
This home is located at 1972 Graystone Pkwy Unit 3, Grayson, GA 30017 and is currently estimated at $398,506, approximately $156 per square foot. 1972 Graystone Pkwy Unit 3 is a home located in Gwinnett County with nearby schools including Grayson Elementary School, Bay Creek Middle School, and Grayson High School.
Ownership History
Date
Name
Owned For
Owner Type
Purchase Details
Closed on
Jun 13, 2013
Sold by
Pearson Amy Michelle
Bought by
Pearson Amy Michelle and Pearson Christopher J
Current Estimated Value
Home Financials for this Owner
Home Financials are based on the most recent Mortgage that was taken out on this home.
Original Mortgage
$144,337
Outstanding Balance
$103,853
Interest Rate
3.75%
Mortgage Type
FHA
Estimated Equity
$294,653
Purchase Details
Closed on
Dec 21, 2001
Sold by
Beam Steven A
Bought by
Beam Kristy L
Purchase Details
Closed on
Dec 17, 1997
Sold by
Long Robert D and Long Laura L
Bought by
Beam Steven A and Beam Kristy L
Home Financials for this Owner
Home Financials are based on the most recent Mortgage that was taken out on this home.
Original Mortgage
$99,400
Interest Rate
7.26%
Mortgage Type
New Conventional
Create a Home Valuation Report for This Property
The Home Valuation Report is an in-depth analysis detailing your home's value as well as a comparison with similar homes in the area
Home Values in the Area
Average Home Value in this Area
Purchase History
| Date | Buyer | Sale Price | Title Company |
|---|---|---|---|
| Pearson Amy Michelle | $147,000 | -- | |
| Pearson Amy Michelle | $147,000 | -- | |
| Beam Kristy L | -- | -- | |
| Beam Steven A | $142,000 | -- |
Source: Public Records
Mortgage History
| Date | Status | Borrower | Loan Amount |
|---|---|---|---|
| Open | Pearson Amy Michelle | $144,337 | |
| Closed | Pearson Amy Michelle | $144,337 | |
| Previous Owner | Beam Steven A | $99,400 |
Source: Public Records
Tax History Compared to Growth
Tax History
| Year | Tax Paid | Tax Assessment Tax Assessment Total Assessment is a certain percentage of the fair market value that is determined by local assessors to be the total taxable value of land and additions on the property. | Land | Improvement |
|---|---|---|---|---|
| 2025 | $6,365 | $170,360 | $26,120 | $144,240 |
| 2024 | $5,527 | $144,720 | $26,120 | $118,600 |
| 2023 | $5,527 | $158,040 | $31,200 | $126,840 |
| 2022 | $5,239 | $137,920 | $24,800 | $113,120 |
| 2021 | $4,195 | $106,920 | $18,800 | $88,120 |
| 2020 | $3,664 | $91,640 | $18,800 | $72,840 |
| 2019 | $3,530 | $91,640 | $18,800 | $72,840 |
| 2018 | $3,134 | $80,280 | $16,800 | $63,480 |
| 2016 | $2,649 | $65,960 | $14,800 | $51,160 |
| 2015 | $2,422 | $58,800 | $10,000 | $48,800 |
| 2014 | $2,435 | $58,800 | $10,000 | $48,800 |
Source: Public Records
Map
Nearby Homes
- 1919 Waterton Ct Unit 3
- 621 Pineberry Ct
- 2031 Lakewood Cir
- 2028 Lakewood Cir
- 2122 Graystone Pkwy
- 811 Pineberry Ct
- 1133 Willow Trace
- 1860 Pinehurst View Dr
- 986 Lakeview Oaks Ct Unit 26-B
- 986 Lakeview Oaks Ct
- 1210 Hogan Ridge Dr
- 1241 Hogan Ridge Ct
- 917 Mount Mckinley Way
- 1891 Bennett Rd
- 956 Lakeview Oaks Ct
- 946 Ct
- 946 Lakeview Oaks Ct
- 936 Lakeview Oaks Ct
- 936 Lakeview Oaks Ct Unit 30-B
- 1962 Graystone Pkwy
- 1982 Graystone Pkwy
- 1973 Graystone Pkwy Unit 3
- 1983 Graystone Pkwy Unit 3
- 1983 Graystone Pkwy
- 1963 Graystone Pkwy
- 1992 Graystone Pkwy Unit 3
- 1952 Graystone Pkwy Unit 3
- 1993 Graystone Pkwy
- 1942 Graystone Pkwy
- 2002 Graystone Pkwy
- 1928 Waterton Ct
- 1938 Waterton Ct
- 1965 Lakewood Trace Unit 4
- 2012 Graystone Pkwy
- 1932 Graystone Pkwy Unit 3
- 1945 Lakewood Trace Unit 4
- 2011 Graystone Pkwy
- 1968 Waterton Ct
- 1955 Lakewood Trace