Estimated Value: $343,000 - $542,999
5
Beds
4
Baths
4,287
Sq Ft
$108/Sq Ft
Est. Value
About This Home
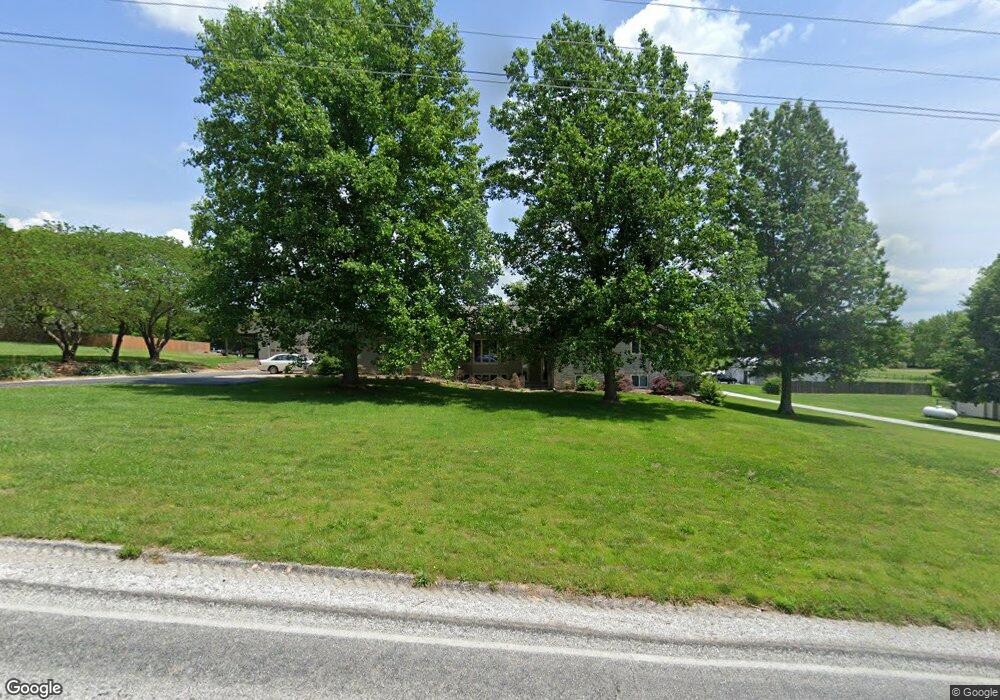
This home is located at 1972 N Nicholas Rd, Nixa, MO 65714 and is currently estimated at $461,500, approximately $107 per square foot. 1972 N Nicholas Rd is a home located in Christian County with nearby schools including Espy Elementary School, Nicholas A. Inman Intermediate School, and Nixa Junior High School.
Ownership History
Date
Name
Owned For
Owner Type
Purchase Details
Closed on
Jan 20, 2022
Sold by
Lee Kirsch Norman and Lee Jean Debbie
Bought by
Debbie Jean Kirsch As Trustees
Current Estimated Value
Purchase Details
Closed on
Jan 20, 2021
Sold by
Joint Revocable Trust
Bought by
Kirsch Norman and Christian State Of Missouri
Home Financials for this Owner
Home Financials are based on the most recent Mortgage that was taken out on this home.
Original Mortgage
$200,000
Interest Rate
3.22%
Mortgage Type
Credit Line Revolving
Purchase Details
Closed on
Apr 30, 2020
Sold by
Kirsch Norman Lee and Kirsch Debbie Jean
Bought by
Kirsch Norman Lee and Kirsch Debbie Jean
Home Financials for this Owner
Home Financials are based on the most recent Mortgage that was taken out on this home.
Original Mortgage
$145,000
Interest Rate
3.6%
Mortgage Type
New Conventional
Create a Home Valuation Report for This Property
The Home Valuation Report is an in-depth analysis detailing your home's value as well as a comparison with similar homes in the area
Home Values in the Area
Average Home Value in this Area
Purchase History
| Date | Buyer | Sale Price | Title Company |
|---|---|---|---|
| Debbie Jean Kirsch As Trustees | -- | None Listed On Document | |
| Kirsch Norman | -- | None Listed On Document | |
| Kirsch Norman Lee | -- | Preferred Title | |
| Kirsch Norman Lee | -- | Preferred Title Of Mo Inc |
Source: Public Records
Mortgage History
| Date | Status | Borrower | Loan Amount |
|---|---|---|---|
| Previous Owner | Kirsch Norman | $200,000 | |
| Previous Owner | Kirsch Norman Lee | $145,000 |
Source: Public Records
Tax History
| Year | Tax Paid | Tax Assessment Tax Assessment Total Assessment is a certain percentage of the fair market value that is determined by local assessors to be the total taxable value of land and additions on the property. | Land | Improvement |
|---|---|---|---|---|
| 2025 | $3,103 | $56,700 | -- | -- |
| 2024 | $3,103 | $52,290 | -- | -- |
| 2023 | $3,103 | $52,290 | -- | -- |
| 2022 | $2,512 | $42,290 | $0 | $0 |
| 2021 | $1,937 | $32,590 | $0 | $0 |
| 2020 | $1,802 | $28,990 | $0 | $0 |
| 2019 | $1,802 | $28,990 | $0 | $0 |
| 2018 | $1,467 | $25,440 | $0 | $0 |
| 2017 | $1,467 | $25,440 | $0 | $0 |
| 2016 | $1,442 | $25,440 | $0 | $0 |
| 2015 | $1,444 | $25,440 | $25,440 | $0 |
| 2014 | $1,411 | $25,520 | $0 | $0 |
| 2013 | $1,413 | $25,520 | $0 | $0 |
| 2011 | -- | $51,040 | $0 | $0 |
Source: Public Records
Map
Nearby Homes
- 0 Guin Rd Unit Lot C-4 60247503
- 2069 Preakness Dr
- 1518 W Stagecoach Ct
- 1518 Coach House Ct
- 1522 W Porterfield Dr
- 2025 N Equestrian Ln
- 2037 N Prato Ct
- 907 W Lorenza Dr
- 851 Meadowview Dr
- 1918 N Brookhollow Dr
- 000 Lot 8 Tuscany Hills
- 1930 Seabrook Dr
- 814 Julie Ct
- 114 English Village
- 816 W Myra Dr
- 709 W Jackson Ave
- 1343 W Tracker Rd
- 908 Domino Ct
- 2801 W Oxbow Ln
- 5946 S Hearthstone Ct
- 1952 N Nicholas Rd
- 1968 N Nicholas Rd
- 1975 N Nicholas Rd
- 1294 W Guin Rd
- 1318 Giun Rd
- 1310 W Guin Rd
- 0 Guin Rd Unit 11312579
- 0 Guin Rd Unit 60008983
- 0 Guin Rd Unit 60008988
- 0 Guin Rd Unit 60008987
- 0 Guin Rd Unit 60008984
- 0 Guin Rd Unit 60094028
- 0 Guin Rd Unit 60094027
- 0 Guin Rd Unit 60094026
- 1295 Guin Rd
- 0 State Highway Aa
- 1262 W Guin Rd
- 2000 N Nicholas Rd
- 1936 N Nicholas Rd
- 1271 W Guin Rd
Your Personal Tour Guide
Ask me questions while you tour the home.