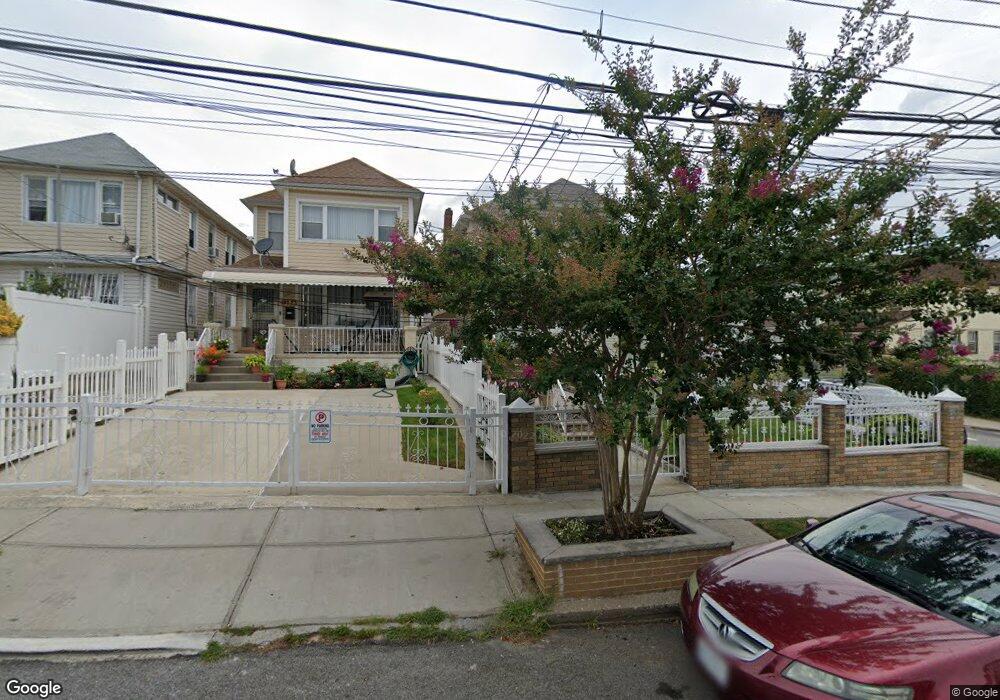
19725 90th Ave Hollis, NY 11423
Hollis NeighborhoodEstimated Value: $952,280 - $1,164,000
--
Bed
--
Bath
2,744
Sq Ft
$386/Sq Ft
Est. Value
About This Home
This home is located at 19725 90th Ave, Hollis, NY 11423 and is currently estimated at $1,058,070, approximately $385 per square foot. 19725 90th Ave is a home located in Queens County with nearby schools including P.S. 35 Nathaniel Woodhull, I.S. 238 Susan B Anthony Academy, and The Wellspring Schools.
Ownership History
Date
Name
Owned For
Owner Type
Purchase Details
Closed on
Dec 21, 1999
Sold by
Mohabir Ramesh and Mohabir Nandrani
Bought by
Mohabir Nandrani and Sukhdeo Annette
Current Estimated Value
Home Financials for this Owner
Home Financials are based on the most recent Mortgage that was taken out on this home.
Original Mortgage
$174,800
Outstanding Balance
$54,597
Interest Rate
7.83%
Estimated Equity
$1,003,473
Purchase Details
Closed on
May 7, 1997
Sold by
Fugaro Anthony and Fugaro Frank
Bought by
Mohabir Ramesh and Mohabir Nandrani
Home Financials for this Owner
Home Financials are based on the most recent Mortgage that was taken out on this home.
Original Mortgage
$170,000
Interest Rate
7.81%
Create a Home Valuation Report for This Property
The Home Valuation Report is an in-depth analysis detailing your home's value as well as a comparison with similar homes in the area
Home Values in the Area
Average Home Value in this Area
Purchase History
| Date | Buyer | Sale Price | Title Company |
|---|---|---|---|
| Mohabir Nandrani | $22,500 | -- | |
| Mohabir Nandrani | -- | -- | |
| Mohabir Ramesh | $212,500 | Commonwealth Land Title Ins | |
| Mohabir Ramesh | $212,500 | Commonwealth Land Title Ins |
Source: Public Records
Mortgage History
| Date | Status | Borrower | Loan Amount |
|---|---|---|---|
| Open | Mohabir Nandrani | $174,800 | |
| Closed | Mohabir Nandrani | $174,800 | |
| Previous Owner | Mohabir Ramesh | $170,000 |
Source: Public Records
Tax History Compared to Growth
Tax History
| Year | Tax Paid | Tax Assessment Tax Assessment Total Assessment is a certain percentage of the fair market value that is determined by local assessors to be the total taxable value of land and additions on the property. | Land | Improvement |
|---|---|---|---|---|
| 2025 | $7,135 | $39,139 | $10,650 | $28,489 |
| 2024 | $7,147 | $36,924 | $10,930 | $25,994 |
| 2023 | $6,716 | $34,836 | $9,318 | $25,518 |
| 2022 | $6,667 | $60,060 | $16,980 | $43,080 |
| 2021 | $6,979 | $52,140 | $16,980 | $35,160 |
| 2020 | $6,608 | $46,800 | $16,980 | $29,820 |
| 2019 | $6,144 | $42,120 | $16,980 | $25,140 |
| 2018 | $5,620 | $29,030 | $11,347 | $17,683 |
| 2017 | $5,618 | $29,030 | $13,602 | $15,428 |
| 2016 | $5,449 | $29,030 | $13,602 | $15,428 |
| 2015 | $3,083 | $27,180 | $15,982 | $11,198 |
| 2014 | $3,083 | $25,642 | $17,131 | $8,511 |
Source: Public Records
Map
Nearby Homes
- 89-48 196th St
- 90-35 198th St
- 88-27 196th St
- 8925 201st St
- 88-38 201st St
- 88-44 202nd St
- 9051 201st St
- 88-49 202nd St
- 196-33 Foothill Ave
- 19633 Foothill Ave
- 92-22 195th Place
- 93-17 201st St
- 9302 202nd St
- 9048 204th St
- 9317 197th St
- 90-62 204th St
- 197-21 Carpenter Ave Unit 1G
- 19515 Woodhull Ave
- 197-31 Carpenter Ave
- 9141 195th St