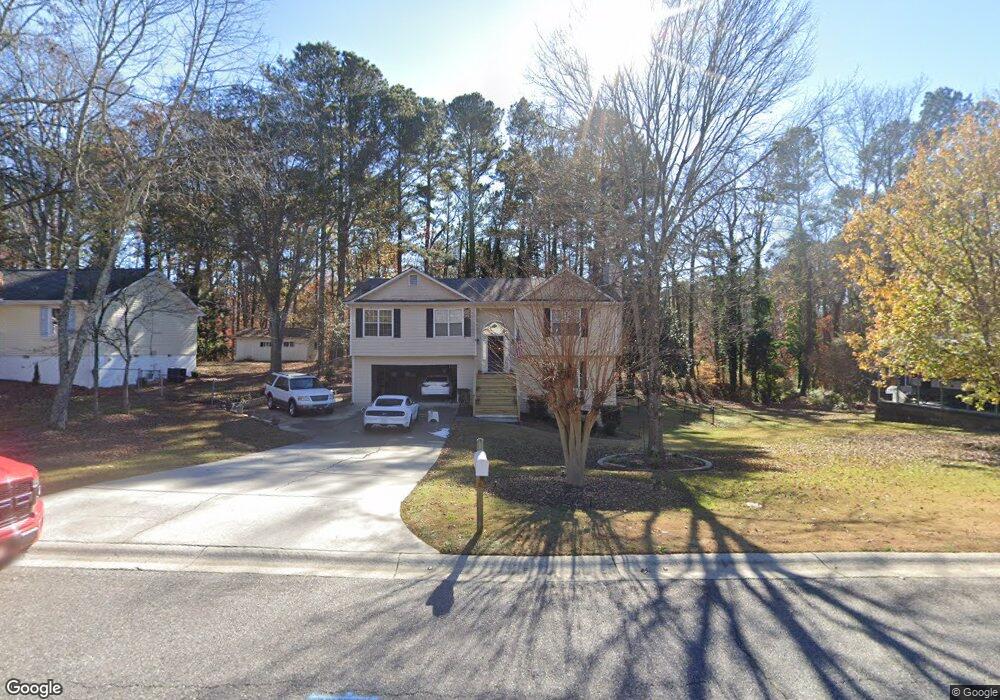
1973 Anchor Way Buford, GA 30518
Estimated Value: $383,000 - $436,000
4
Beds
3
Baths
2,086
Sq Ft
$194/Sq Ft
Est. Value
About This Home
This home is located at 1973 Anchor Way, Buford, GA 30518 and is currently estimated at $404,827, approximately $194 per square foot. 1973 Anchor Way is a home located in Gwinnett County with nearby schools including Buford Elementary School, Buford Academy, and Buford Senior Academy.
Ownership History
Date
Name
Owned For
Owner Type
Purchase Details
Closed on
Aug 2, 2011
Sold by
Bowbritt
Bought by
Sbb Land
Current Estimated Value
Purchase Details
Closed on
Apr 5, 2011
Sold by
Gmac Mtg Llc
Bought by
Secretary Of Veterans Affairs
Purchase Details
Closed on
Jan 16, 2002
Sold by
Bjork Troy and Bjork Kim
Bought by
Feken Shawn and Feken Shannon E
Home Financials for this Owner
Home Financials are based on the most recent Mortgage that was taken out on this home.
Original Mortgage
$139,900
Interest Rate
7.08%
Mortgage Type
VA
Purchase Details
Closed on
Jun 15, 1998
Sold by
Cohron Wes K and Cohron Patricia A
Bought by
Bjork Troy and Bjork Kim
Home Financials for this Owner
Home Financials are based on the most recent Mortgage that was taken out on this home.
Original Mortgage
$91,200
Interest Rate
7.14%
Mortgage Type
New Conventional
Purchase Details
Closed on
May 19, 1995
Sold by
Thompson Rickey F
Bought by
Cohron Wes K Patricia
Purchase Details
Closed on
Mar 3, 1995
Sold by
Cohron Weston K Patricia
Bought by
Thompson Ricky F
Create a Home Valuation Report for This Property
The Home Valuation Report is an in-depth analysis detailing your home's value as well as a comparison with similar homes in the area
Home Values in the Area
Average Home Value in this Area
Purchase History
| Date | Buyer | Sale Price | Title Company |
|---|---|---|---|
| Sbb Land | $69,000 | -- | |
| Bowbritt | $69,000 | -- | |
| Secretary Of Veterans Affairs | -- | -- | |
| Gmac Mtg Llc | $109,399 | -- | |
| Feken Shawn | $139,900 | -- | |
| Bjork Troy | $114,000 | -- | |
| Cohron Wes K Patricia | $78,000 | -- | |
| Thompson Ricky F | $10,000 | -- |
Source: Public Records
Mortgage History
| Date | Status | Borrower | Loan Amount |
|---|---|---|---|
| Previous Owner | Feken Shawn | $139,900 | |
| Previous Owner | Bjork Troy | $91,200 | |
| Closed | Thompson Ricky F | $0 |
Source: Public Records
Tax History Compared to Growth
Tax History
| Year | Tax Paid | Tax Assessment Tax Assessment Total Assessment is a certain percentage of the fair market value that is determined by local assessors to be the total taxable value of land and additions on the property. | Land | Improvement |
|---|---|---|---|---|
| 2025 | -- | $134,320 | $32,000 | $102,320 |
| 2024 | -- | $138,440 | $25,200 | $113,240 |
| 2023 | $1,892 | $131,880 | $22,000 | $109,880 |
| 2022 | $0 | $116,000 | $17,600 | $98,400 |
| 2021 | $1,448 | $100,920 | $17,600 | $83,320 |
| 2020 | $945 | $90,640 | $15,200 | $75,440 |
| 2019 | $945 | $72,960 | $12,000 | $60,960 |
| 2018 | $945 | $72,960 | $12,000 | $60,960 |
| 2016 | $560 | $43,720 | $6,600 | $37,120 |
| 2015 | $580 | $43,720 | $6,600 | $37,120 |
| 2014 | $590 | $43,720 | $6,600 | $37,120 |
Source: Public Records
Map
Nearby Homes
- 1983 Anchor Way Unit 1
- 5774 Harbor Dr
- 1920 Patrick Mill Place
- 5820 Elm Tree Dr Unit 1
- 2030 Buford Dam Rd
- 2243 Bedstone Dr Unit 2
- 5600 Creek Dale Way
- 5871 Dolvin Ln
- 5601 Creek Dale Way
- 1770 Patrick Mill Place
- 2090 Mina Lane Dr
- 6265 Lake Windsor Pkwy
- 5552 Little Mill Rd
- 2015 Buford Dam Rd
- 1930 Marina Way
- 2075 Pine Tree Dr Unit B2
- 2075 Pine Tree Dr Unit A3
- 5984 Dolvin Ln
- 6205 Ambercrest Ct
- 5995 Lake Windsor Pkwy Unit 1
- 1963 Anchor Way
- 1953 Anchor Way
- 1993 Anchor Way
- 1968 Shipwreck Ct Unit 2
- 1978 Shipwreck Ct
- 1988 Shipwreck Ct Unit 2
- 1974 Anchor Way
- 1998 Shipwreck Ct
- 1984 Anchor Way
- 1964 Anchor Way
- 2003 Anchor Way
- 1994 Anchor Way
- 1954 Anchor Way
- 5805 Harbor Dr
- 2008 Shipwreck Ct
- 5789 Harbor Dr Unit 1
- 5789 Harbor Dr
- 2004 Anchor Way
- 5813 Harbor Dr
- 2018 Shipwreck Ct