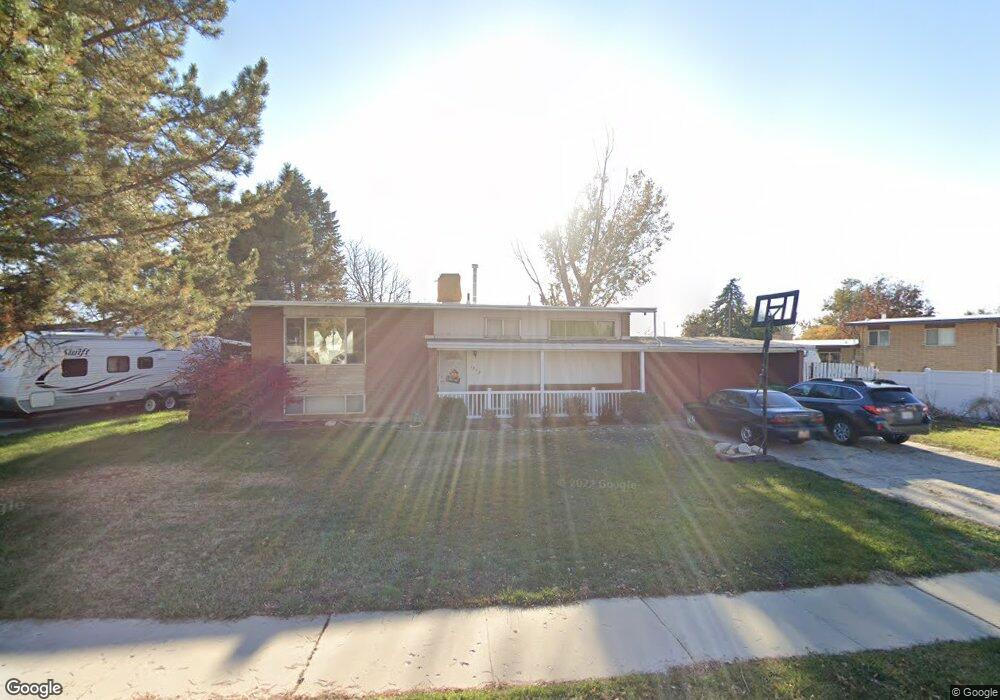
1973 Matthew Dr Layton, UT 84041
Estimated Value: $395,000 - $455,000
4
Beds
2
Baths
2,050
Sq Ft
$208/Sq Ft
Est. Value
About This Home
This home is located at 1973 Matthew Dr, Layton, UT 84041 and is currently estimated at $425,611, approximately $207 per square foot. 1973 Matthew Dr is a home located in Davis County with nearby schools including Vae View Elementary School, Central Davis Junior High School, and Layton High School.
Ownership History
Date
Name
Owned For
Owner Type
Purchase Details
Closed on
Jul 14, 2023
Sold by
Chatelain Anthony A and Chatelain Tori A
Bought by
Bugni Austin
Current Estimated Value
Home Financials for this Owner
Home Financials are based on the most recent Mortgage that was taken out on this home.
Original Mortgage
$360,050
Outstanding Balance
$350,938
Interest Rate
6.69%
Mortgage Type
New Conventional
Estimated Equity
$74,673
Purchase Details
Closed on
Sep 8, 2003
Sold by
Perkes Brett Dee and Perkes Lana K
Bought by
Chatelain Anthony A and Chatelain Tori A
Home Financials for this Owner
Home Financials are based on the most recent Mortgage that was taken out on this home.
Original Mortgage
$103,950
Interest Rate
7.87%
Mortgage Type
Purchase Money Mortgage
Create a Home Valuation Report for This Property
The Home Valuation Report is an in-depth analysis detailing your home's value as well as a comparison with similar homes in the area
Home Values in the Area
Average Home Value in this Area
Purchase History
We collect this data history from publicly available records. To have your information removed, we recommend requesting removal directly through your county’s website.
| Date | Buyer | Sale Price | Title Company |
|---|---|---|---|
| Bugni Austin | -- | Real Advantage Title | |
| Chatelain Anthony A | -- | Bonneville Title Company Inc |
Source: Public Records
Mortgage History
We collect this data history from publicly available records. To have your information removed, we recommend requesting removal directly through your county’s website.
| Date | Status | Borrower | Loan Amount |
|---|---|---|---|
| Open | Bugni Austin | $360,050 | |
| Previous Owner | Chatelain Anthony A | $103,950 |
Source: Public Records
Tax History
| Year | Tax Paid | Tax Assessment Tax Assessment Total Assessment is a certain percentage of the fair market value that is determined by local assessors to be the total taxable value of land and additions on the property. | Land | Improvement |
|---|---|---|---|---|
| 2025 | $2,085 | $218,900 | $105,228 | $113,672 |
| 2024 | -- | $216,150 | $125,611 | $90,539 |
| 2023 | $1,953 | $364,000 | $162,734 | $201,266 |
| 2022 | $2,114 | $213,950 | $76,530 | $137,420 |
| 2021 | $1,921 | $290,000 | $109,186 | $180,814 |
| 2020 | $1,602 | $232,000 | $80,574 | $151,426 |
| 2019 | $1,593 | $226,000 | $77,478 | $148,522 |
| 2018 | $1,398 | $199,000 | $71,739 | $127,261 |
| 2016 | $1,216 | $89,320 | $20,524 | $68,796 |
| 2015 | $1,173 | $81,785 | $20,524 | $61,261 |
| 2014 | $1,109 | $79,101 | $20,524 | $58,577 |
| 2013 | -- | $75,429 | $20,680 | $54,749 |
Source: Public Records
Map
Nearby Homes
- 2054 W Mark St
- 1847 John St
- 1896 Cliff Place
- 1870 N Celia Way
- 1838 N 1690 W
- 1995 Clyde St
- 1613 N 1850 W
- 1618 W Camelot Dr
- 1713 N 1625 W
- 1650 N Main St Unit 126
- 949 E Chris Cir
- 1748 N 1600 W
- 1883 W 1575 N Unit 236
- 1740 N 1600 W Unit 116
- 1888 W 1575 N Unit 235
- 1858 W 1575 N Unit 240
- 1415 S 1250 E
- 1696 N 1600 W
- 1688 N 1600 W
- 1664 N 1600 W
- 1955 Matthew Dr
- 1908 N Gregory Dr
- 1892 N Gregory Dr
- 1892 N Gregory Dr Unit 142
- 1945 Matthew Dr
- 1970 Matthew Dr
- 1978 Matthew Dr
- 1876 N Gregory Dr
- 1962 Matthew Dr
- 1940 N Gregory Dr
- 1952 Matthew Dr
- 1935 Matthew Dr
- 1942 Matthew Dr
- 1982 W Mark St
- 1862 N Gregory Dr
- 1891 N Gregory Dr
- 1929 N Gregory Dr
- 1981 W Celia Way
- 1934 Matthew Dr
- 1903 Matthew Dr
Your Personal Tour Guide
Ask me questions while you tour the home.