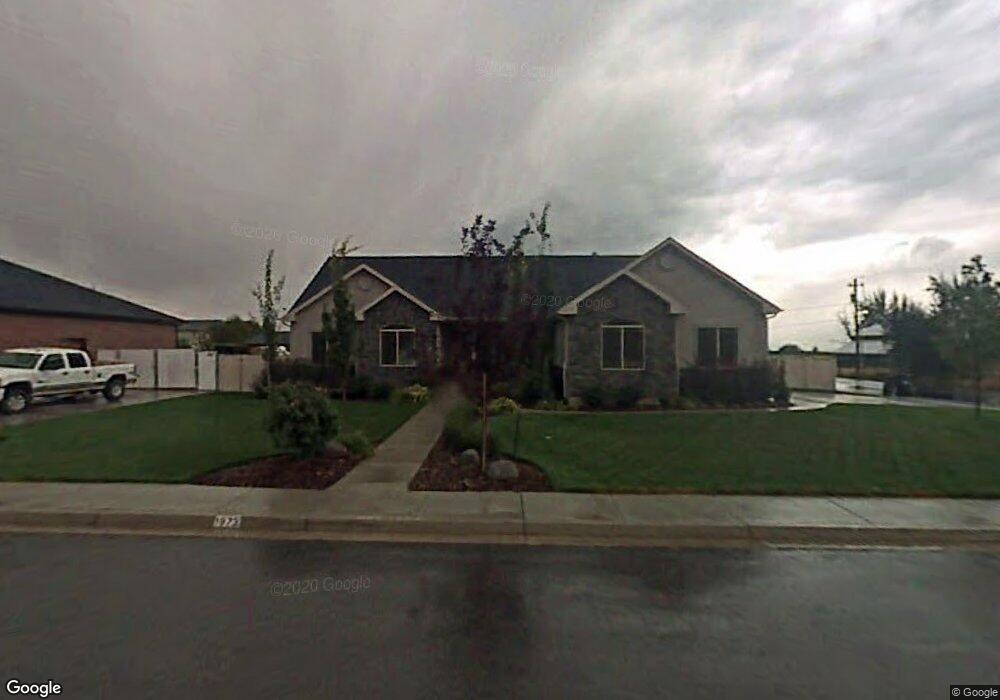
1973 N 600 W Mapleton, UT 84664
Estimated Value: $582,000 - $713,350
3
Beds
2
Baths
1,793
Sq Ft
$373/Sq Ft
Est. Value
About This Home
This home is located at 1973 N 600 W, Mapleton, UT 84664 and is currently estimated at $669,338, approximately $373 per square foot. 1973 N 600 W is a home located in Utah County with nearby schools including Hobble Creek School, Mapleton Junior High School, and Maple Mountain High School.
Ownership History
Date
Name
Owned For
Owner Type
Purchase Details
Closed on
Mar 17, 2015
Sold by
Christensen Ryan
Bought by
Christensen Ryan J and Christensen Kari L
Current Estimated Value
Purchase Details
Closed on
Jan 19, 2009
Sold by
Christensen Ryan
Bought by
Christensen Ryan
Home Financials for this Owner
Home Financials are based on the most recent Mortgage that was taken out on this home.
Original Mortgage
$170,500
Outstanding Balance
$109,542
Interest Rate
5.49%
Mortgage Type
New Conventional
Estimated Equity
$559,796
Purchase Details
Closed on
Apr 13, 2005
Sold by
Telschow Daniel and Telschow Betsey
Bought by
Christensen Ryan
Home Financials for this Owner
Home Financials are based on the most recent Mortgage that was taken out on this home.
Original Mortgage
$180,000
Interest Rate
5.77%
Mortgage Type
Fannie Mae Freddie Mac
Create a Home Valuation Report for This Property
The Home Valuation Report is an in-depth analysis detailing your home's value as well as a comparison with similar homes in the area
Home Values in the Area
Average Home Value in this Area
Purchase History
| Date | Buyer | Sale Price | Title Company |
|---|---|---|---|
| Christensen Ryan J | -- | Pro Title And Escrow Inc | |
| Christensen Ryan | -- | Inwest Title Services Inc | |
| Christensen Ryan | -- | Equity Title Orem Blvd |
Source: Public Records
Mortgage History
| Date | Status | Borrower | Loan Amount |
|---|---|---|---|
| Open | Christensen Ryan | $170,500 | |
| Closed | Christensen Ryan | $180,000 |
Source: Public Records
Tax History Compared to Growth
Tax History
| Year | Tax Paid | Tax Assessment Tax Assessment Total Assessment is a certain percentage of the fair market value that is determined by local assessors to be the total taxable value of land and additions on the property. | Land | Improvement |
|---|---|---|---|---|
| 2025 | $3,230 | $336,710 | $254,000 | $358,200 |
| 2024 | $3,230 | $316,415 | $0 | $0 |
| 2023 | $3,364 | $331,650 | $0 | $0 |
| 2022 | $3,799 | $370,260 | $0 | $0 |
| 2021 | $3,211 | $480,600 | $161,100 | $319,500 |
| 2020 | $3,192 | $462,100 | $142,600 | $319,500 |
| 2019 | $2,917 | $431,000 | $136,900 | $294,100 |
| 2018 | $2,561 | $360,300 | $115,200 | $245,100 |
| 2017 | $2,410 | $179,905 | $0 | $0 |
| 2016 | $2,371 | $175,945 | $0 | $0 |
| 2015 | $2,305 | $170,005 | $0 | $0 |
| 2014 | $2,128 | $154,165 | $0 | $0 |
Source: Public Records
Map
Nearby Homes
- 1206 E 1150 S
- 1188 W 2000 N
- 405 W 1200 N Unit 4
- 487 W 1200 N Unit 1
- 645 S Red Devil Dr
- 61 E 750 S Unit 2
- 66 E 750 S Unit 23
- 1047 N 700 W
- 1225 N 1380 W
- 1410 W 1200 N
- 59 E 775 S Unit 21
- 51 E 775 S Unit 20
- 509 Brookside Dr
- 1567 N 600 E Unit 26
- 662 E 1700 N
- 828 N 1140 W
- 695 E 1700 N
- 715 E 1700 N
- 572 W 500 N
- 525 N 420 W