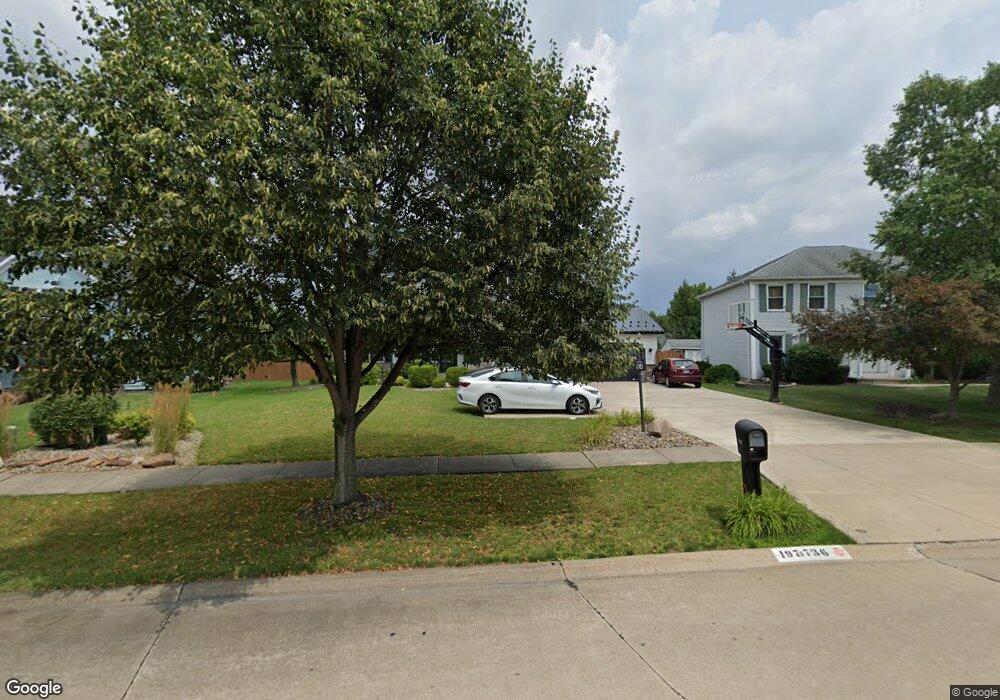
19736 Winding Trail Strongsville, OH 44149
Estimated Value: $434,000 - $460,000
3
Beds
3
Baths
2,438
Sq Ft
$183/Sq Ft
Est. Value
About This Home
This home is located at 19736 Winding Trail, Strongsville, OH 44149 and is currently estimated at $445,532, approximately $182 per square foot. 19736 Winding Trail is a home located in Cuyahoga County with nearby schools including Strongsville High School, Strongsville Academy, and Sts Joseph & John Interparochial School.
Ownership History
Date
Name
Owned For
Owner Type
Purchase Details
Closed on
Jan 17, 2003
Sold by
Jelinek Patricia J
Bought by
Jelinek Michael F and Jelinek Patricia J
Current Estimated Value
Home Financials for this Owner
Home Financials are based on the most recent Mortgage that was taken out on this home.
Original Mortgage
$174,000
Outstanding Balance
$65,977
Interest Rate
4.5%
Mortgage Type
Purchase Money Mortgage
Estimated Equity
$379,555
Purchase Details
Closed on
Jul 12, 2001
Sold by
Green Donald C and Green Karen A
Bought by
Jelinek Patricia J
Home Financials for this Owner
Home Financials are based on the most recent Mortgage that was taken out on this home.
Original Mortgage
$169,000
Interest Rate
7.27%
Purchase Details
Closed on
Aug 3, 1990
Bought by
Green Donald C
Purchase Details
Closed on
Jun 5, 1989
Bought by
Perram Bros. Constr Co Inc
Purchase Details
Closed on
Jan 1, 1989
Bought by
Fragapane Constr Co Inc
Create a Home Valuation Report for This Property
The Home Valuation Report is an in-depth analysis detailing your home's value as well as a comparison with similar homes in the area
Home Values in the Area
Average Home Value in this Area
Purchase History
| Date | Buyer | Sale Price | Title Company |
|---|---|---|---|
| Jelinek Michael F | -- | Competitive Title Agency Inc | |
| Jelinek Patricia J | $239,000 | Title Xperts Agency Inc | |
| Green Donald C | $185,800 | -- | |
| Perram Bros. Constr Co Inc | $32,000 | -- | |
| Fragapane Constr Co Inc | -- | -- |
Source: Public Records
Mortgage History
| Date | Status | Borrower | Loan Amount |
|---|---|---|---|
| Open | Jelinek Michael F | $174,000 | |
| Closed | Jelinek Patricia J | $169,000 |
Source: Public Records
Tax History Compared to Growth
Tax History
| Year | Tax Paid | Tax Assessment Tax Assessment Total Assessment is a certain percentage of the fair market value that is determined by local assessors to be the total taxable value of land and additions on the property. | Land | Improvement |
|---|---|---|---|---|
| 2024 | $6,442 | $137,200 | $27,755 | $109,445 |
| 2023 | $6,849 | $109,380 | $23,800 | $85,580 |
| 2022 | $6,799 | $109,380 | $23,800 | $85,580 |
| 2021 | $6,745 | $109,380 | $23,800 | $85,580 |
| 2020 | $6,932 | $99,440 | $21,630 | $77,810 |
| 2019 | $6,729 | $284,100 | $61,800 | $222,300 |
| 2018 | $5,539 | $90,200 | $21,630 | $68,570 |
| 2017 | $5,475 | $82,530 | $16,870 | $65,660 |
| 2016 | $5,430 | $82,530 | $16,870 | $65,660 |
| 2015 | $5,148 | $82,530 | $16,870 | $65,660 |
| 2014 | $5,148 | $77,140 | $15,750 | $61,390 |
Source: Public Records
Map
Nearby Homes
- 19620 Porters Ln Unit 15F
- 14112 Settlers Way
- 20078 Trapper Trail
- 19160 Wheelers Ln
- 19513 Lunn Rd
- 13156 Olympus Way
- 13099 Olympus Way
- 13066 Olympus Way
- 15017 Regency Dr
- 13236 Tomson Dr
- 18630 Shurmer Rd
- 15279 Walnut Creek Dr
- 14896 Britannia Ct
- 12694 Ionia Ct
- 20678 Spruce Dr
- 12539 Olympus Way
- 12647 Edgepark Cir
- 14400 Prospect Rd
- 12385 Corinth Ct
- 12651 Alameda Dr
- 19704 Winding Trail
- 19768 Winding Trail
- 14507 Fullers Ln Unit J28
- 14491 Fullers Ln
- 14475 Fullers Ln Unit K30
- 14523 Fullers Ln Unit J27
- 19800 Winding Trail
- 14459 Fullers Ln
- 19672 Overland Park Dr
- 14486 Fullers Ln Unit 44
- 14486 Fullers Ln
- 14502 Fullers Ln
- 14502 Fullers Ln Unit 43
- 19650 Overland Park Dr
- 19775 Winding Trail
- 14539 Fullers Ln Unit 26
- 14470 Fullers Ln Unit O45
- 19657 Porters Ln
- 14443 Fullers Ln Unit L32
- 19681 Porters Ln