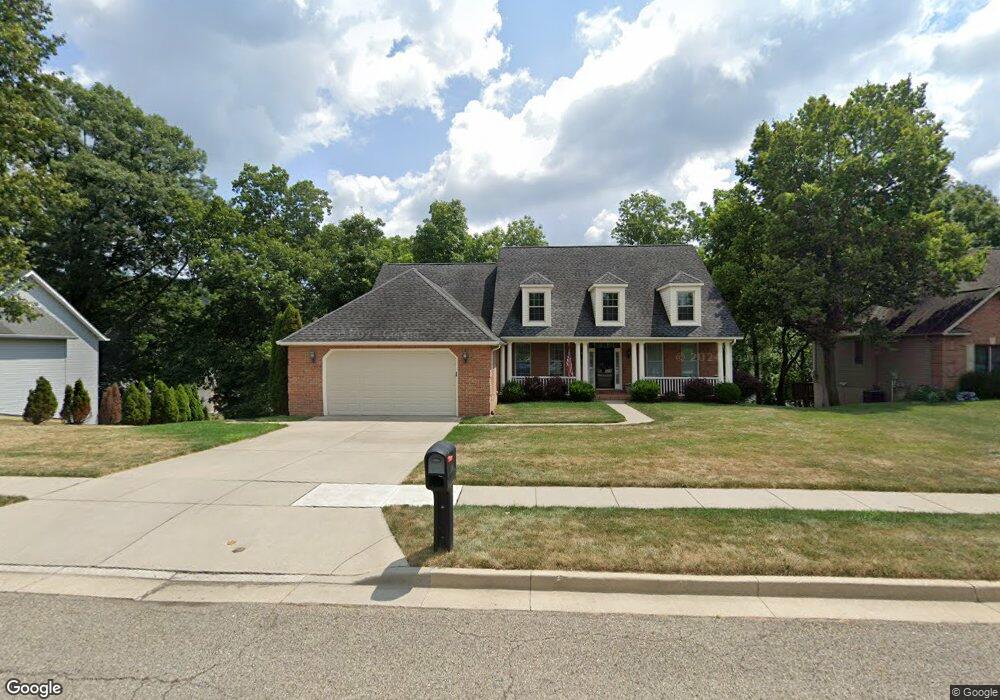
1974 Wacker Dr Lancaster, OH 43130
Estimated Value: $450,000 - $667,000
4
Beds
4
Baths
3,500
Sq Ft
$153/Sq Ft
Est. Value
About This Home
This home is located at 1974 Wacker Dr, Lancaster, OH 43130 and is currently estimated at $536,788, approximately $153 per square foot. 1974 Wacker Dr is a home located in Fairfield County with nearby schools including Tarhe Elementary School, General Sherman Junior High School, and Lancaster High School.
Ownership History
Date
Name
Owned For
Owner Type
Purchase Details
Closed on
Jan 10, 2004
Sold by
Ullom Randall T and Fermo Ullom Rosalie P
Bought by
Ullom Randall T
Current Estimated Value
Purchase Details
Closed on
Mar 14, 2002
Sold by
Eccard Bryan R
Bought by
Fermo-Ullom Randall T Ullom Rosalie P
Home Financials for this Owner
Home Financials are based on the most recent Mortgage that was taken out on this home.
Original Mortgage
$282,600
Outstanding Balance
$113,624
Interest Rate
7.11%
Mortgage Type
New Conventional
Estimated Equity
$423,164
Purchase Details
Closed on
Jul 26, 2001
Sold by
Barbara J Spires Trst
Bought by
Eccard Bryan R and Eccard Kimberly S
Purchase Details
Closed on
Mar 8, 2001
Sold by
Deacon Hill Corp
Bought by
Eccard Daniel G Spires Trustee & Daniel R
Create a Home Valuation Report for This Property
The Home Valuation Report is an in-depth analysis detailing your home's value as well as a comparison with similar homes in the area
Home Values in the Area
Average Home Value in this Area
Purchase History
| Date | Buyer | Sale Price | Title Company |
|---|---|---|---|
| Ullom Randall T | -- | -- | |
| Fermo-Ullom Randall T Ullom Rosalie P | $314,000 | -- | |
| Eccard Bryan R | $56,500 | -- | |
| Eccard Daniel G Spires Trustee & Daniel R | $23,750 | -- |
Source: Public Records
Mortgage History
| Date | Status | Borrower | Loan Amount |
|---|---|---|---|
| Open | Fermo-Ullom Randall T Ullom Rosalie P | $282,600 |
Source: Public Records
Tax History
| Year | Tax Paid | Tax Assessment Tax Assessment Total Assessment is a certain percentage of the fair market value that is determined by local assessors to be the total taxable value of land and additions on the property. | Land | Improvement |
|---|---|---|---|---|
| 2025 | $12,955 | $159,300 | $28,420 | $130,880 |
| 2024 | $12,955 | $144,100 | $13,880 | $130,220 |
| 2023 | $5,241 | $144,100 | $13,880 | $130,220 |
| 2022 | $5,262 | $144,100 | $13,880 | $130,220 |
| 2021 | $4,736 | $121,500 | $13,880 | $107,620 |
| 2020 | $4,193 | $121,500 | $13,880 | $107,620 |
| 2019 | $5,005 | $140,950 | $13,880 | $127,070 |
| 2018 | $4,532 | $115,610 | $13,880 | $101,730 |
| 2017 | $4,533 | $121,220 | $13,500 | $107,720 |
| 2016 | $4,415 | $121,220 | $13,500 | $107,720 |
| 2015 | $4,371 | $116,460 | $13,500 | $102,960 |
| 2014 | $4,163 | $116,460 | $13,500 | $102,960 |
| 2013 | $4,163 | $116,460 | $13,500 | $102,960 |
Source: Public Records
Map
Nearby Homes
- 1836 Glenmar Dr
- 2014 N Columbus St
- 338 Scott Dr
- 202 Wildwood Ave
- 0 Wacker Dr Unit 225036189
- 0 Marks Ave Unit 225036443
- 1125 Zimmer St
- 181 Marks Ave
- 0 Hillside Ave
- 148 Marks Ave
- 1156 Forest Rose Ave
- 1829 Beacon St
- 1004 W Fair Ave
- 844 Washington Ave
- 330 Park St
- 1632 Bush Hill Dr
- 336 Reber Ave
- 1616 W Fair Ave
- 621 Washington Ave
- 1174 Creekview Ct Unit 9-1174
- 1966 Wacker Dr
- 1986 Wacker Dr
- 205 Berkeley Dr
- 211 Berkeley Dr
- 179 Berkeley Dr
- 1902 Deacon Ct
- 1954 Wacker Dr
- 2002 Wacker Dr
- 175 Berkeley Dr
- 219 Berkeley Dr
- 1993 Wacker Dr
- 1963 Wacker Dr
- 0 Deacon Ct Unit 9915637
- 0 Deacon Ct Unit 9915635
- 0 Deacon Ct Unit 9918439
- 0 Deacon Ct Unit 213007411
- 0 Deacon Ct Unit 213007414
- 0 Deacon Ct Unit 215007126
- 169 Berkeley Dr
- 1910 Deacon Ct
Your Personal Tour Guide
Ask me questions while you tour the home.