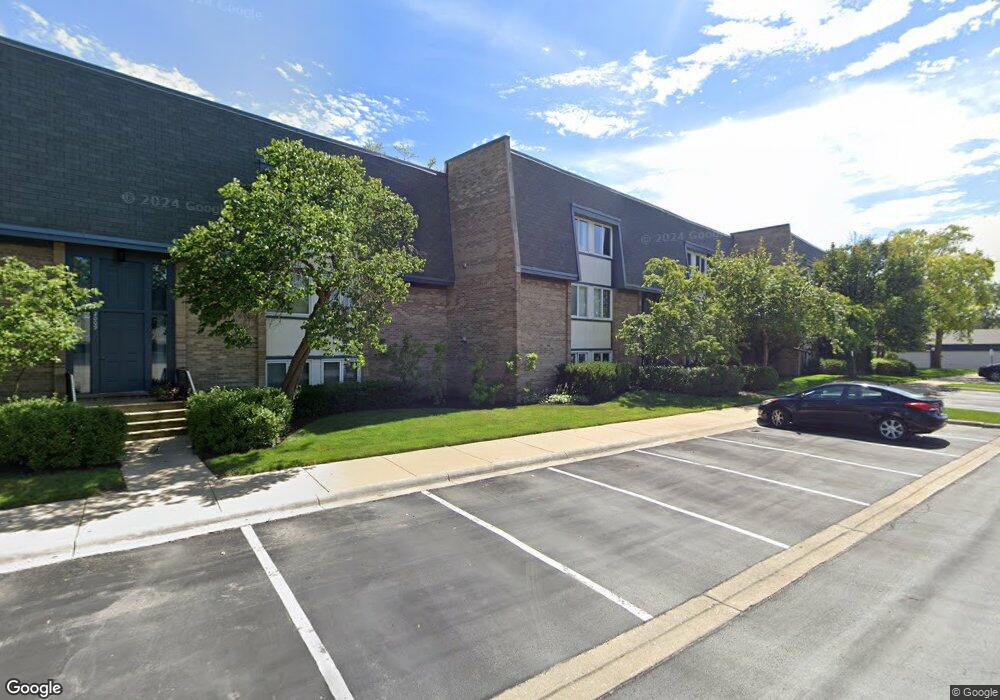
1975 Ammer Ridge Ct Unit 1510 Glenview, IL 60025
Estimated Value: $338,566 - $370,000
2
Beds
--
Bath
1,100
Sq Ft
$323/Sq Ft
Est. Value
About This Home
This home is located at 1975 Ammer Ridge Ct Unit 1510, Glenview, IL 60025 and is currently estimated at $355,392, approximately $323 per square foot. 1975 Ammer Ridge Ct Unit 1510 is a home located in Cook County with nearby schools including Lyon Elementary School, Pleasant Ridge Elementary School, and Attea Middle School.
Ownership History
Date
Name
Owned For
Owner Type
Purchase Details
Closed on
May 12, 2015
Sold by
Krok Karen
Bought by
Gustafson Margaret M
Current Estimated Value
Purchase Details
Closed on
Mar 14, 2007
Sold by
Sager Laura L
Bought by
Krok Karen
Home Financials for this Owner
Home Financials are based on the most recent Mortgage that was taken out on this home.
Original Mortgage
$216,000
Interest Rate
6.25%
Mortgage Type
Purchase Money Mortgage
Purchase Details
Closed on
Apr 10, 1996
Sold by
Kennaugh Michael A and Kennaugh Alicia
Bought by
Sager Laura L
Home Financials for this Owner
Home Financials are based on the most recent Mortgage that was taken out on this home.
Original Mortgage
$126,900
Interest Rate
7.12%
Create a Home Valuation Report for This Property
The Home Valuation Report is an in-depth analysis detailing your home's value as well as a comparison with similar homes in the area
Home Values in the Area
Average Home Value in this Area
Purchase History
| Date | Buyer | Sale Price | Title Company |
|---|---|---|---|
| Gustafson Margaret M | $224,000 | None Available | |
| Krok Karen | $270,000 | None Available | |
| Sager Laura L | $141,000 | Attorneys Natl Title Network |
Source: Public Records
Mortgage History
| Date | Status | Borrower | Loan Amount |
|---|---|---|---|
| Previous Owner | Krok Karen | $216,000 | |
| Previous Owner | Sager Laura L | $126,900 |
Source: Public Records
Tax History Compared to Growth
Tax History
| Year | Tax Paid | Tax Assessment Tax Assessment Total Assessment is a certain percentage of the fair market value that is determined by local assessors to be the total taxable value of land and additions on the property. | Land | Improvement |
|---|---|---|---|---|
| 2024 | $2,160 | $23,831 | $3,449 | $20,382 |
| 2023 | $2,166 | $23,831 | $3,449 | $20,382 |
| 2022 | $2,166 | $23,831 | $3,449 | $20,382 |
| 2021 | $2,440 | $19,980 | $3,535 | $16,445 |
| 2020 | $2,246 | $19,980 | $3,535 | $16,445 |
| 2019 | $2,106 | $22,020 | $3,535 | $18,485 |
| 2018 | $2,168 | $16,297 | $3,104 | $13,193 |
| 2017 | $2,092 | $16,297 | $3,104 | $13,193 |
| 2016 | $2,919 | $16,297 | $3,104 | $13,193 |
| 2015 | $2,596 | $13,525 | $2,673 | $10,852 |
| 2014 | $2,561 | $13,525 | $2,673 | $10,852 |
| 2013 | -- | $13,525 | $2,673 | $10,852 |
Source: Public Records
Map
Nearby Homes
- 1740 Melise Dr
- 1743 Melise Dr
- 2101 Valley lo Ln
- 1410 Tuscany Ct
- 1855 Tanglewood Dr Unit F
- 1847 Tanglewood Dr Unit 3B
- 1847 Tanglewood Dr Unit 2B
- 1719 Wildberry Dr Unit B
- 431 4th St
- 1508 Pebblecreek Dr Unit 14
- 2000 Chestnut Ave Unit 103
- 804 8th St
- 1553 Hawthorne Ln
- 1300 W Branch Rd
- 1429 Pebblecreek Dr Unit 171
- 1050 Burton Terrace
- 1342 Pine St
- 1341 Greenwillow Ln Unit C
- 1975 Ammer Ridge Ct Unit 1510
- 1975 Ammer Ridge Ct Unit 1520
- 1975 Ammer Ridge Ct Unit 1530
- 1975 Ammer Ridge Ct Unit 1520
- 1975 Ammer Ridge Ct Unit 1530
- 1975 Ammer Ridge Ct Unit 201
- 1975 Ammer Ridge Ct Unit 101
- 1975 Ammer Ridge Ct Unit 102
- 1979 Ammer Ridge Ct Unit 202
- 1979 Ammer Ridge Ct Unit 1620
- 1979 Ammer Ridge Ct Unit 1630
- 1979 Ammer Ridge Ct Unit 1620
- 1979 Ammer Ridge Ct Unit 1630
- 1979 Ammer Ridge Ct Unit 1610
- 1979 Ammer Ridge Ct Unit 1610
- 1979 Ammer Ridge Ct Unit 102
- 1979 Ammer Ridge Ct Unit 302
- 1979 Ammer Ridge Ct Unit 301
- 1979 Ammer Ridge Ct
- 1971 Ammer Ridge Ct Unit 1420