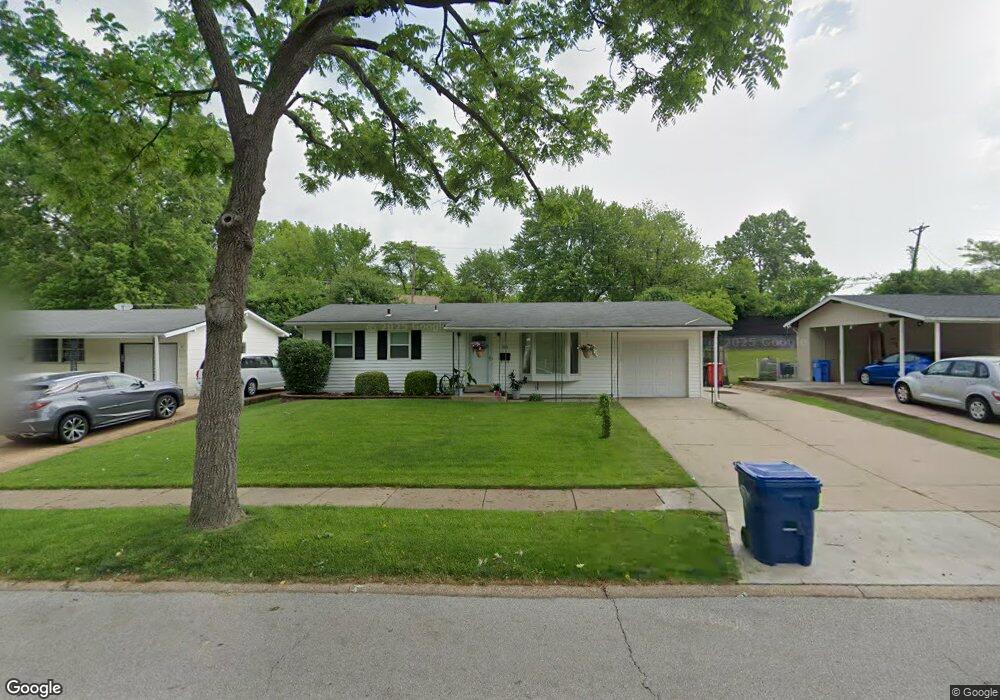
1975 Tahoe Dr Florissant, MO 63031
Estimated Value: $156,000 - $174,896
3
Beds
1
Bath
912
Sq Ft
$178/Sq Ft
Est. Value
About This Home
This home is located at 1975 Tahoe Dr, Florissant, MO 63031 and is currently estimated at $162,474, approximately $178 per square foot. 1975 Tahoe Dr is a home located in St. Louis County with nearby schools including Russell Elementary School, West Middle School, and Hazelwood West High School.
Ownership History
Date
Name
Owned For
Owner Type
Purchase Details
Closed on
Jul 10, 2015
Sold by
Clark Kelly M and Orrick William T
Bought by
Orrick Kelly M and Orrick William T
Current Estimated Value
Home Financials for this Owner
Home Financials are based on the most recent Mortgage that was taken out on this home.
Original Mortgage
$24,000
Outstanding Balance
$16,951
Interest Rate
4.06%
Mortgage Type
Credit Line Revolving
Estimated Equity
$145,523
Purchase Details
Closed on
Nov 20, 1997
Sold by
Light Carl J and Light Dorothy J
Bought by
Orrick William T and Clark Kelly M
Home Financials for this Owner
Home Financials are based on the most recent Mortgage that was taken out on this home.
Original Mortgage
$69,836
Outstanding Balance
$11,492
Interest Rate
7.31%
Mortgage Type
FHA
Estimated Equity
$150,982
Create a Home Valuation Report for This Property
The Home Valuation Report is an in-depth analysis detailing your home's value as well as a comparison with similar homes in the area
Home Values in the Area
Average Home Value in this Area
Purchase History
| Date | Buyer | Sale Price | Title Company |
|---|---|---|---|
| Orrick Kelly M | -- | Security Title Ins Agency Cm | |
| Orrick William T | -- | -- |
Source: Public Records
Mortgage History
| Date | Status | Borrower | Loan Amount |
|---|---|---|---|
| Open | Orrick Kelly M | $24,000 | |
| Open | Orrick William T | $69,836 |
Source: Public Records
Tax History Compared to Growth
Tax History
| Year | Tax Paid | Tax Assessment Tax Assessment Total Assessment is a certain percentage of the fair market value that is determined by local assessors to be the total taxable value of land and additions on the property. | Land | Improvement |
|---|---|---|---|---|
| 2025 | $2,374 | $28,730 | $5,400 | $23,330 |
| 2024 | $2,374 | $26,500 | $2,770 | $23,730 |
| 2023 | $2,374 | $26,500 | $2,770 | $23,730 |
| 2022 | $1,928 | $19,150 | $4,010 | $15,140 |
| 2021 | $1,879 | $19,150 | $4,010 | $15,140 |
| 2020 | $1,733 | $16,630 | $3,100 | $13,530 |
| 2019 | $1,707 | $16,630 | $3,100 | $13,530 |
| 2018 | $1,590 | $14,230 | $2,790 | $11,440 |
| 2017 | $1,588 | $14,230 | $2,790 | $11,440 |
| 2016 | $1,563 | $13,810 | $2,790 | $11,020 |
| 2015 | $1,530 | $13,810 | $2,790 | $11,020 |
| 2014 | $1,584 | $14,750 | $3,650 | $11,100 |
Source: Public Records
Map
Nearby Homes
- 1035 Rosary Tree Ct
- 1090 Howdershell Rd
- 154 Riverwood Park Dr
- 1565 Yaqui Dr
- 7250 Howdershell Rd
- 7240 Howdershell Rd
- 1495 Yaqui Dr
- 1978 Acorn Trail Dr
- 805 Coach Light Ln
- 5 Seminary Ct
- 753 Coach Light Ln
- 1815 Flordawn Dr
- 7565 English Coach Ln
- 7525 English Coach Ln
- 1085 Campion Ln
- 2 Taylor Trail Place
- 698 Carriage Ln
- 1160 Kostka Ln
- 1030 Gifford Ct
- 912 Shamrock Dr
- 1965 Tahoe Dr
- 1995 Tahoe Dr
- 1038 Willow River Ct
- 2005 Tahoe Dr
- 1970 Tahoe Dr
- 1032 Willow River Ct
- 1960 Tahoe Dr
- 1990 Tahoe Dr
- 1039 Lanawood Ct
- 1037 Willow River Ct
- 1925 Tahoe Dr
- 2025 Tahoe Dr
- 1033 Lanawood Ct
- 2000 Tahoe Dr
- 1940 Tahoe Dr
- 1920 Tahoe Dr
- 1026 Willow River Ct
- 1905 Tahoe Dr
- 2045 Tahoe Dr
- 2045 Yaqui Dr