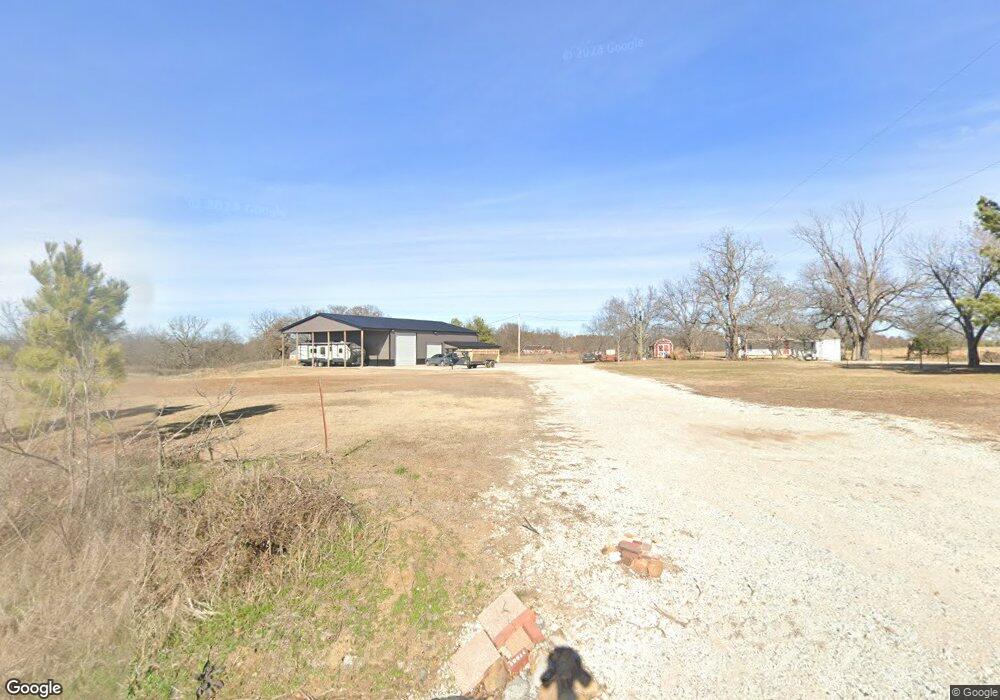
19765 Sharp Rd Okmulgee, OK 74447
Estimated Value: $196,000 - $301,000
2
Beds
1
Bath
1,032
Sq Ft
$257/Sq Ft
Est. Value
About This Home
This home is located at 19765 Sharp Rd, Okmulgee, OK 74447 and is currently estimated at $264,962, approximately $256 per square foot. 19765 Sharp Rd is a home located in Okmulgee County with nearby schools including Okmulgee Primary School, Okmulgee Middle School, and Dunbar Elementary School.
Ownership History
Date
Name
Owned For
Owner Type
Purchase Details
Closed on
Feb 7, 2024
Sold by
Redman Jason Kyle and Redman Yadira
Bought by
Ray Amy
Current Estimated Value
Purchase Details
Closed on
Oct 27, 2022
Sold by
Keesee Sharon L and Keesee Billy
Bought by
Redman Jason Kyle
Purchase Details
Closed on
Oct 8, 2008
Sold by
Fuller Charles and Fuller Kebra
Bought by
Fuller Sharon L
Home Financials for this Owner
Home Financials are based on the most recent Mortgage that was taken out on this home.
Original Mortgage
$28,163
Interest Rate
6.08%
Mortgage Type
FHA
Purchase Details
Closed on
Feb 13, 2006
Sold by
Fuller E L and Fuller Helen I
Bought by
Fuller Sharon L
Create a Home Valuation Report for This Property
The Home Valuation Report is an in-depth analysis detailing your home's value as well as a comparison with similar homes in the area
Purchase History
| Date | Buyer | Sale Price | Title Company |
|---|---|---|---|
| Ray Amy | -- | None Listed On Document | |
| Redman Jason Kyle | -- | None Listed On Document | |
| Redman Jason Kyle | -- | -- | |
| Fuller Sharon L | -- | None Available | |
| Fuller Sharon L | -- | None Available |
Source: Public Records
Mortgage History
| Date | Status | Borrower | Loan Amount |
|---|---|---|---|
| Previous Owner | Fuller Sharon L | $28,163 |
Source: Public Records
Tax History
| Year | Tax Paid | Tax Assessment Tax Assessment Total Assessment is a certain percentage of the fair market value that is determined by local assessors to be the total taxable value of land and additions on the property. | Land | Improvement |
|---|---|---|---|---|
| 2025 | $3,122 | $34,059 | $1,355 | $32,704 |
| 2024 | $379 | $4,189 | $1,402 | $2,787 |
| 2023 | $380 | $4,464 | $1,677 | $2,787 |
| 2022 | $111 | $2,313 | $868 | $1,445 |
| 2021 | $110 | $2,313 | $868 | $1,445 |
| 2020 | $104 | $2,180 | $818 | $1,362 |
| 2019 | $99 | $2,117 | $794 | $1,323 |
| 2018 | $94 | $2,055 | $770 | $1,285 |
| 2017 | $88 | $1,996 | $601 | $1,395 |
| 2016 | $75 | $1,842 | $601 | $1,241 |
| 2015 | $68 | $1,789 | $647 | $1,142 |
| 2014 | $64 | $1,736 | $627 | $1,109 |
Source: Public Records
Map
Nearby Homes
- 20270 S 930 Rd W
- 17784 S 210 Rd
- 22395 Wilson Rd
- 13020 Birch Rd
- 1018 S Dogwood Ave
- 0 Bristlecone Rd
- 14690 U S Highway 62
- 623 W 15th St
- 811 S Taft Ave
- 13067 Bristlecone Rd
- 901 S Florida Ave
- 422 E 24th St
- 120 S Madison Ave
- 1104 W 9th St
- 1100 W 9th St
- 1121 W 9th St
- 900 W 10th St
- 627 S Alabama Ave
- 1615 W 4th St
- 609 S Alabama Ave
- 19754 Sharp Rd
- 19780 Sharp Rd
- 19950 Sharp Rd
- 19748 Sharp Rd
- 19660 Sharp Rd
- 19530 Sharp Rd
- 19530 Sharp Rd
- 19975 Sharp Rd
- 19730 Sharp Rd
- 19763 Sharp Rd
- 20015 Sharp Rd
- 19270 Sharp Rd
- 20030 Sharp Rd
- 20395 S 180 Rd
- 20070 Sharp Rd
- 20270 S 195 Rd
- 20410 Wilson Rd
- 20410 Wilson Rd
- 20455 S 200 Rd
- 20515 S 200 Rd
Your Personal Tour Guide
Ask me questions while you tour the home.