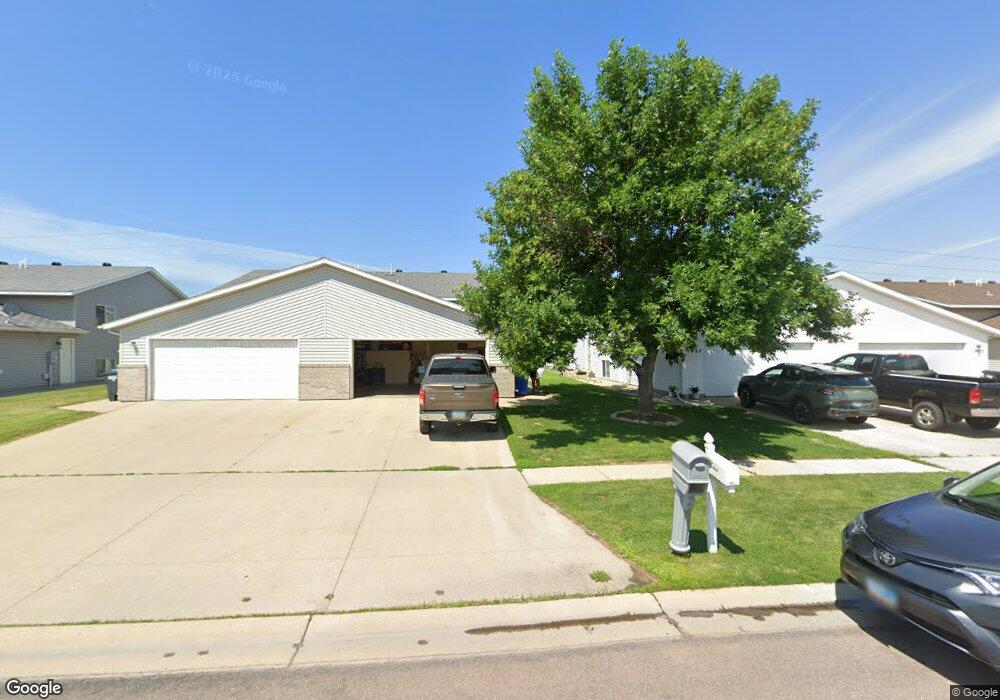
1977 52nd St SW Fargo, ND 58103
Willow Park NeighborhoodEstimated Value: $250,000 - $271,000
3
Beds
1
Bath
1,678
Sq Ft
$156/Sq Ft
Est. Value
About This Home
This home is located at 1977 52nd St SW, Fargo, ND 58103 and is currently estimated at $261,780, approximately $156 per square foot. 1977 52nd St SW is a home located in Cass County with nearby schools including Eastwood Elementary School, Cheney Middle School, and West Fargo High School.
Ownership History
Date
Name
Owned For
Owner Type
Purchase Details
Closed on
Aug 23, 2024
Sold by
Rost Heather and Rost Ashley
Bought by
Graber Gage W
Current Estimated Value
Home Financials for this Owner
Home Financials are based on the most recent Mortgage that was taken out on this home.
Original Mortgage
$255,375
Outstanding Balance
$252,429
Interest Rate
6.77%
Mortgage Type
VA
Estimated Equity
$9,351
Purchase Details
Closed on
Jul 3, 2019
Sold by
Cheney Patty M
Bought by
Rost Heather and Rost Ashley
Home Financials for this Owner
Home Financials are based on the most recent Mortgage that was taken out on this home.
Original Mortgage
$186,725
Interest Rate
4%
Mortgage Type
New Conventional
Purchase Details
Closed on
Sep 28, 2012
Sold by
Soberg Nikki J
Bought by
Cheney Patty M
Home Financials for this Owner
Home Financials are based on the most recent Mortgage that was taken out on this home.
Original Mortgage
$134,850
Interest Rate
3.37%
Mortgage Type
FHA
Create a Home Valuation Report for This Property
The Home Valuation Report is an in-depth analysis detailing your home's value as well as a comparison with similar homes in the area
Home Values in the Area
Average Home Value in this Area
Purchase History
| Date | Buyer | Sale Price | Title Company |
|---|---|---|---|
| Graber Gage W | $250,000 | Fm Title | |
| Rost Heather | $192,500 | Title Co | |
| Cheney Patty M | $137,400 | None Available |
Source: Public Records
Mortgage History
| Date | Status | Borrower | Loan Amount |
|---|---|---|---|
| Open | Graber Gage W | $255,375 | |
| Previous Owner | Rost Heather | $186,725 | |
| Previous Owner | Cheney Patty M | $134,850 |
Source: Public Records
Tax History Compared to Growth
Tax History
| Year | Tax Paid | Tax Assessment Tax Assessment Total Assessment is a certain percentage of the fair market value that is determined by local assessors to be the total taxable value of land and additions on the property. | Land | Improvement |
|---|---|---|---|---|
| 2024 | $2,508 | $117,550 | $21,100 | $96,450 |
| 2023 | $2,549 | $102,350 | $15,200 | $87,150 |
| 2022 | $2,386 | $91,400 | $15,200 | $76,200 |
| 2021 | $2,318 | $87,900 | $15,200 | $72,700 |
| 2020 | $2,170 | $83,700 | $15,200 | $68,500 |
| 2019 | $2,095 | $81,250 | $8,450 | $72,800 |
| 2018 | $2,425 | $81,250 | $8,450 | $72,800 |
| 2017 | $2,335 | $78,900 | $8,450 | $70,450 |
| 2016 | $2,171 | $76,600 | $8,450 | $68,150 |
| 2015 | $2,096 | $69,350 | $6,350 | $63,000 |
| 2014 | $2,052 | $64,200 | $6,350 | $57,850 |
| 2013 | $2,069 | $64,200 | $6,350 | $57,850 |
Source: Public Records
Map
Nearby Homes
- 1970 Burlington Dr
- 2103 52nd St S
- 1842 52nd St S
- 1859 13th St E
- 1829 13th St E
- 1534 Baywood Dr
- 1522 Baywood Dr
- 1836 12th St E
- 1845 Huntington Ct
- 4470 24th Ave S Unit 703
- 4470 24th Ave S Unit 604
- 4470 24th Ave S Unit 303
- 4470 24th Ave S Unit 606
- 4470 24th Ave S Unit 602
- 4470 24th Ave S Unit 301
- 4470 24th Ave S Unit 302
- 4470 24th Ave S Unit 502
- 4470 24th Ave S Unit 603
- 4470 24th Ave S Unit 506
- 4470 24th Ave S Unit 601
- 1957 52nd St SW
- 1979 52nd St SW
- 1977 52nd St S
- 1993 52nd St SW
- 1957 52nd St S
- 1955 52nd St S
- 1979 52nd St S
- 1955 52nd St S
- 1933 52nd St SW
- 1995 52nd St SW
- 1933 52nd St S
- 1995 52nd St S
- 2003 52nd St SW
- 1974 52nd St SW
- 1960 52nd St SW
- 1931 52nd St S
- 1931 52nd St SW
- 1986 52nd St SW
- 2003 52nd St S
- 1976 52nd St SW