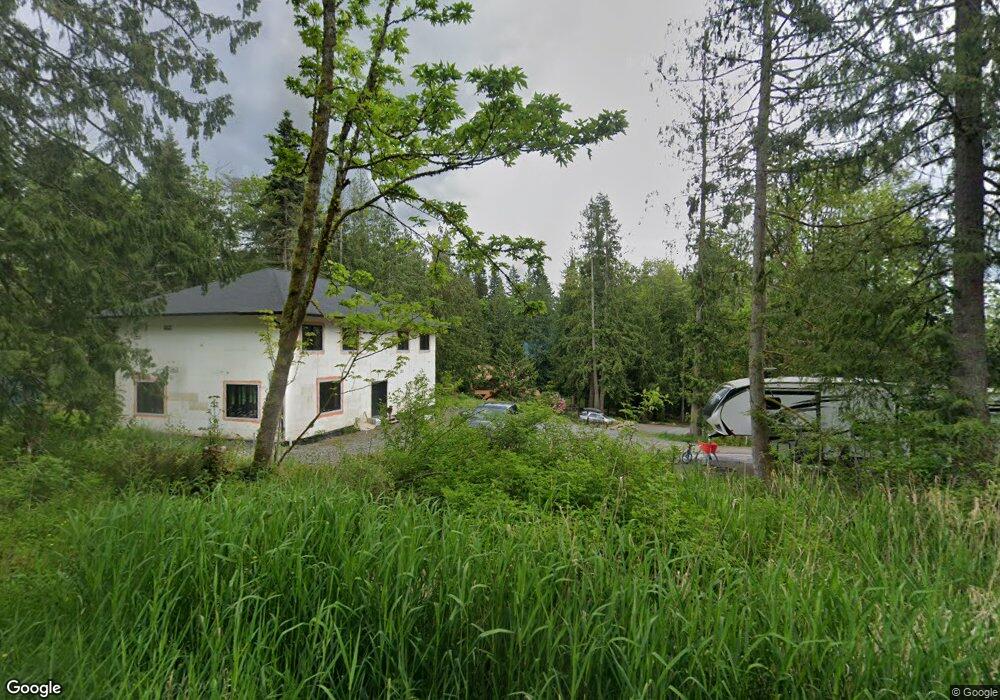
1977 Academy Rd Bellingham, WA 98226
Estimated Value: $1,011,000 - $1,084,000
3
Beds
3
Baths
2,060
Sq Ft
$510/Sq Ft
Est. Value
About This Home
This home is located at 1977 Academy Rd, Bellingham, WA 98226 and is currently estimated at $1,050,230, approximately $509 per square foot. 1977 Academy Rd is a home located in Whatcom County with nearby schools including Silver Beach Elementary School, Whatcom Middle School, and Squalicum High School.
Ownership History
Date
Name
Owned For
Owner Type
Purchase Details
Closed on
Sep 24, 2019
Sold by
Prichason William and Prichason Ian Marcia
Bought by
Saldivar Sherri G and Saldivar Manuel S
Current Estimated Value
Home Financials for this Owner
Home Financials are based on the most recent Mortgage that was taken out on this home.
Original Mortgage
$375,000
Outstanding Balance
$328,471
Interest Rate
3.6%
Mortgage Type
New Conventional
Estimated Equity
$721,759
Purchase Details
Closed on
Aug 14, 2015
Sold by
Sherman Bruce and Sherman Peggy
Bought by
Prichason William and Ian Marcia
Home Financials for this Owner
Home Financials are based on the most recent Mortgage that was taken out on this home.
Original Mortgage
$417,000
Interest Rate
4.05%
Mortgage Type
New Conventional
Create a Home Valuation Report for This Property
The Home Valuation Report is an in-depth analysis detailing your home's value as well as a comparison with similar homes in the area
Home Values in the Area
Average Home Value in this Area
Purchase History
| Date | Buyer | Sale Price | Title Company |
|---|---|---|---|
| Saldivar Sherri G | $625,000 | Whatcom Land Title | |
| Prichason William | $525,000 | Whatcom Land Title |
Source: Public Records
Mortgage History
| Date | Status | Borrower | Loan Amount |
|---|---|---|---|
| Open | Saldivar Sherri G | $375,000 | |
| Previous Owner | Prichason William | $417,000 |
Source: Public Records
Tax History Compared to Growth
Tax History
| Year | Tax Paid | Tax Assessment Tax Assessment Total Assessment is a certain percentage of the fair market value that is determined by local assessors to be the total taxable value of land and additions on the property. | Land | Improvement |
|---|---|---|---|---|
| 2024 | $8,934 | $1,042,318 | $473,172 | $569,146 |
| 2023 | $8,934 | $1,018,912 | $462,547 | $556,365 |
| 2022 | $6,953 | $806,240 | $364,210 | $442,030 |
| 2021 | $6,947 | $665,914 | $300,600 | $365,314 |
| 2020 | $6,763 | $626,097 | $250,971 | $375,126 |
| 2019 | $6,102 | $596,283 | $239,020 | $357,263 |
| 2018 | $6,600 | $553,873 | $222,020 | $331,853 |
| 2017 | $5,438 | $511,463 | $205,020 | $306,443 |
| 2016 | $5,092 | $439,367 | $176,120 | $263,247 |
| 2015 | $4,815 | $424,099 | $170,000 | $254,099 |
| 2014 | -- | $389,793 | $163,250 | $226,543 |
| 2013 | -- | $428,649 | $196,200 | $232,449 |
Source: Public Records
Map
Nearby Homes
- 1944 Discovery Heights Dr
- 3401 E 17th Crest
- 2933 Toad Lake Rd
- 1715 Eagleridge Dr
- 3244 Agate Heights Rd
- 3108 NHN Northshore Rd
- 3717 Toad Lake Rd
- 3319 Sunny Cove Ct
- 11 Academy Highlands Dr
- 8 Academy Highlands Dr
- 3666 Woodlake Rd
- 4522 E Oregon St
- 2141 Northshore Rd
- 4501 E Oregon St
- 1580 Hillsdale Rd
- 4431 Alice St
- 1558 Fairview St
- 3856 Gala Loop
- 1555 Fairview St
- 4414 Alice St
- 3455 Noahs Way
- 3443 Noahs Way
- 1963 Academy Rd
- 1 Academy Rd
- 0 Academy Rd
- 0 Academy Rd Unit NWM20905671
- 0 Academy Rd Unit NWM1438805
- 1979 Academy Rd
- 3483 Noahs Way
- 3454 Noahs Way
- 3437 Noahs Way
- 3488 Noahs Way
- 1975 Academy Rd
- 3462 Noahs Way
- 2039 Academy Rd
- 3436 Noahs Way
- 3421 Noahs Way
- 1990 Academy Rd
- 3525 Stoney Ridge Dr
- 2040 Academy Rd