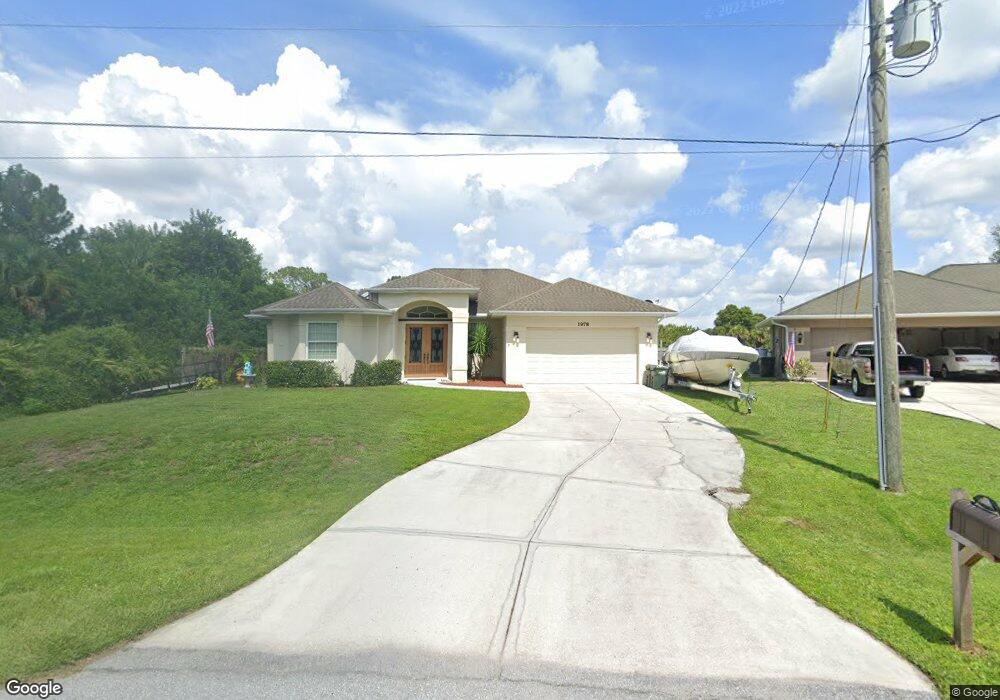
1978 Clovelon St North Port, FL 34291
Estimated Value: $360,000 - $429,000
3
Beds
2
Baths
1,909
Sq Ft
$201/Sq Ft
Est. Value
About This Home
This home is located at 1978 Clovelon St, North Port, FL 34291 and is currently estimated at $383,769, approximately $201 per square foot. 1978 Clovelon St is a home located in Sarasota County with nearby schools including Glenallen Elementary School, North Port High School, and Heron Creek Middle School.
Ownership History
Date
Name
Owned For
Owner Type
Purchase Details
Closed on
Jan 5, 2009
Sold by
Duby Edward L and Duby Suzanne A
Bought by
Carpenter Kenneth J and Carpenter Veronica I
Current Estimated Value
Home Financials for this Owner
Home Financials are based on the most recent Mortgage that was taken out on this home.
Original Mortgage
$189,005
Outstanding Balance
$124,292
Interest Rate
5.95%
Mortgage Type
FHA
Estimated Equity
$259,477
Purchase Details
Closed on
Aug 11, 2005
Sold by
Duby Edward L and Duby Suzanne A
Bought by
Duby Edward L and Duby Suzanne A
Purchase Details
Closed on
Feb 3, 2005
Sold by
Toback Amy S
Bought by
Duby Edward L and Duby Suzanne A
Home Financials for this Owner
Home Financials are based on the most recent Mortgage that was taken out on this home.
Original Mortgage
$198,000
Interest Rate
5.72%
Mortgage Type
Purchase Money Mortgage
Purchase Details
Closed on
Jun 28, 1993
Sold by
Nationsbank Fl
Bought by
Weed Charles P and Weed Alene H
Create a Home Valuation Report for This Property
The Home Valuation Report is an in-depth analysis detailing your home's value as well as a comparison with similar homes in the area
Home Values in the Area
Average Home Value in this Area
Purchase History
| Date | Buyer | Sale Price | Title Company |
|---|---|---|---|
| Carpenter Kenneth J | $191,500 | Stewart Title Company | |
| Duby Edward L | -- | Attorney | |
| Duby Edward L | $35,000 | First American Title Ins Co | |
| Weed Charles P | $4,400 | -- |
Source: Public Records
Mortgage History
| Date | Status | Borrower | Loan Amount |
|---|---|---|---|
| Open | Carpenter Kenneth J | $189,005 | |
| Previous Owner | Duby Edward L | $198,000 |
Source: Public Records
Tax History Compared to Growth
Tax History
| Year | Tax Paid | Tax Assessment Tax Assessment Total Assessment is a certain percentage of the fair market value that is determined by local assessors to be the total taxable value of land and additions on the property. | Land | Improvement |
|---|---|---|---|---|
| 2024 | $2,434 | $153,511 | -- | -- |
| 2023 | $2,434 | $146,127 | $0 | $0 |
| 2022 | $2,382 | $141,871 | $0 | $0 |
| 2021 | $2,324 | $137,739 | $0 | $0 |
| 2020 | $2,299 | $135,837 | $0 | $0 |
| 2019 | $2,223 | $132,783 | $0 | $0 |
| 2018 | $2,063 | $130,307 | $0 | $0 |
| 2017 | $2,026 | $127,627 | $0 | $0 |
| 2016 | $2,002 | $193,700 | $5,500 | $188,200 |
| 2015 | $2,024 | $164,300 | $4,600 | $159,700 |
| 2014 | $2,002 | $121,328 | $0 | $0 |
Source: Public Records
Map
Nearby Homes
- LOT 4 Red Coach Ave
- 8307 Glover Ave
- 0 Delk Lot #16 Ave Unit MFRC7513492
- LOT 30 Clovelon St
- 0 Clovelon St
- 0 Clovelon St Unit MFRN6138608
- 0 Delong Ave Unit MFRC7517027
- 8315 Raoul Ave
- 1200 N Biscayne Dr
- 0 Cosgrove Rd Unit MFRC7494376
- 0 Cosgrove Rd Unit 225049120
- 0 Glover Ave Unit MFRC7503652
- 8335 Drolet Ave
- 0972169150 Raoul Ave
- 0 N Biscayne Dr Unit A4560392
- 0 Torgerson St Unit MFRA4665010
- 0 Drolet Ave Unit MFRT3480089
- 7648 Totem Ave
- 1998 Embassy Rd
- 0 Logsdon St
- 1958 Clovelon St
- 2005 Clovelon St
- 0 Sanacure Ave Unit MFRA4601739
- 0 Sanacure Ave Unit N6119501
- 0 Sanacure Ave Unit N6119491
- 0 Sanacure Ave Unit A4517566
- 2068 Clovelon St
- 2045 Clovelon St
- 1950 Emrick St
- 2108 Street
- 2108 Clovelon St
- Clovelon St
- Clovelon St
- Clovelon St
- 8066 Loxley Ave
- 8070 Loxley Ave
- Delong Ave
- Delong Ave
- 2058 Emrick St