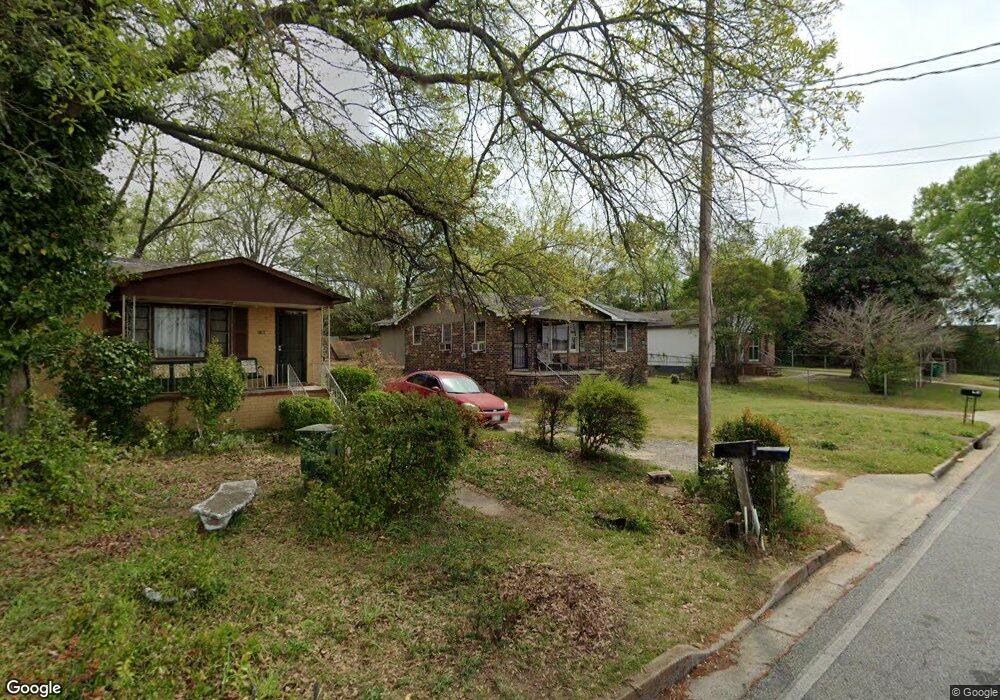
1978 Dove St Macon, GA 31204
Estimated Value: $45,000 - $75,000
3
Beds
1
Bath
1,020
Sq Ft
$60/Sq Ft
Est. Value
About This Home
This home is located at 1978 Dove St, Macon, GA 31204 and is currently estimated at $61,395, approximately $60 per square foot. 1978 Dove St is a home located in Bibb County with nearby schools including Ingram-Pye Elementary School, Southwest High School, and Cirrus Charter Academy.
Ownership History
Date
Name
Owned For
Owner Type
Purchase Details
Closed on
May 23, 2023
Sold by
M Q Properties Llc
Bought by
Wm Gray Investments Llc
Current Estimated Value
Purchase Details
Closed on
Aug 17, 2020
Sold by
The Max Properties Llc
Bought by
Mq Properties Llc
Purchase Details
Closed on
Jul 16, 2020
Sold by
Oliver Betty P
Bought by
The Max Properties Llc
Purchase Details
Closed on
Dec 14, 1990
Sold by
Oliver Warren H By Extrx
Bought by
Oliver Betty P
Create a Home Valuation Report for This Property
The Home Valuation Report is an in-depth analysis detailing your home's value as well as a comparison with similar homes in the area
Purchase History
| Date | Buyer | Sale Price | Title Company |
|---|---|---|---|
| Wm Gray Investments Llc | $120,000 | None Listed On Document | |
| Mq Properties Llc | $39,390 | None Listed On Document | |
| Mq Properties Llc | $889,669 | None Available | |
| The Max Properties Llc | -- | None Available | |
| Oliver Betty P | -- | -- |
Source: Public Records
Tax History
| Year | Tax Paid | Tax Assessment Tax Assessment Total Assessment is a certain percentage of the fair market value that is determined by local assessors to be the total taxable value of land and additions on the property. | Land | Improvement |
|---|---|---|---|---|
| 2025 | $484 | $19,707 | $2,565 | $17,142 |
| 2024 | $501 | $19,707 | $2,565 | $17,142 |
| 2023 | $578 | $19,513 | $1,900 | $17,613 |
| 2022 | $568 | $16,407 | $3,396 | $13,011 |
| 2021 | $336 | $8,840 | $2,401 | $6,439 |
| 2020 | $220 | $5,675 | $1,698 | $3,977 |
| 2019 | $222 | $5,675 | $1,698 | $3,977 |
| 2018 | $520 | $5,675 | $1,698 | $3,977 |
| 2017 | $213 | $5,675 | $1,698 | $3,977 |
| 2016 | $196 | $5,676 | $1,698 | $3,977 |
| 2015 | $278 | $5,676 | $1,698 | $3,977 |
| 2014 | $433 | $7,692 | $3,396 | $4,295 |
Source: Public Records
Map
Nearby Homes
Your Personal Tour Guide
Ask me questions while you tour the home.