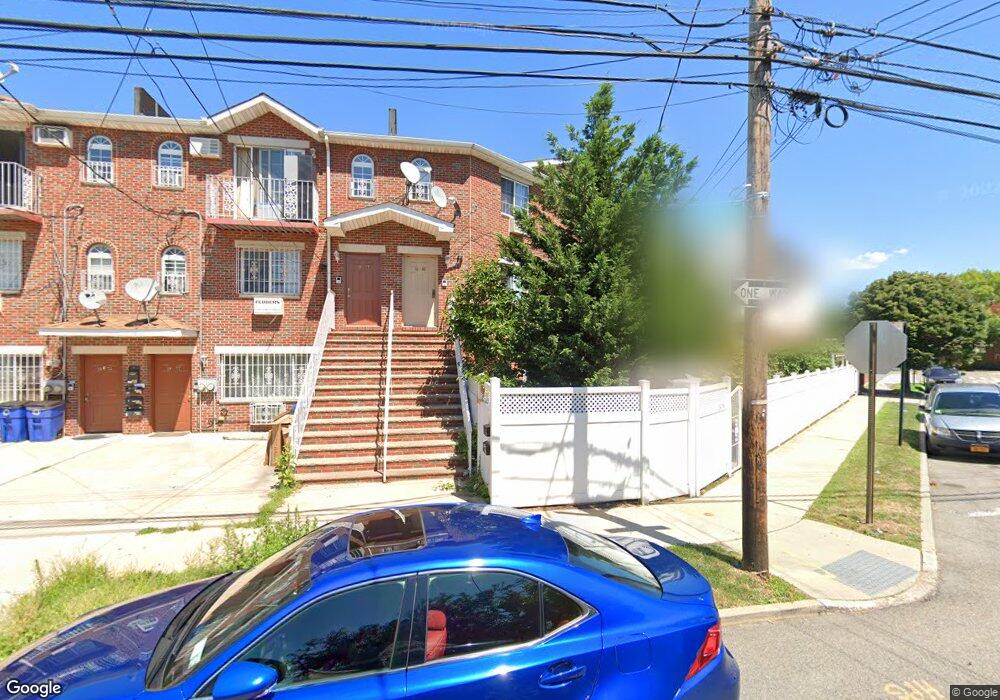
1979 76th St East Elmhurst, NY 11370
Ditmars Steinway NeighborhoodEstimated Value: $1,393,000 - $1,461,000
--
Bed
--
Bath
2,976
Sq Ft
$482/Sq Ft
Est. Value
About This Home
This home is located at 1979 76th St, East Elmhurst, NY 11370 and is currently estimated at $1,435,539, approximately $482 per square foot. 1979 76th St is a home located in Queens County with nearby schools including P.S. 2 Alfred Zimberg, Is 141 The Steinway, and William Cullen Bryant High School.
Ownership History
Date
Name
Owned For
Owner Type
Purchase Details
Closed on
Dec 18, 2024
Sold by
Mujevic Almera and Mujevic Ismet
Bought by
Aly Amr Z and Niemyjska Marta
Current Estimated Value
Home Financials for this Owner
Home Financials are based on the most recent Mortgage that was taken out on this home.
Original Mortgage
$700,000
Outstanding Balance
$694,484
Interest Rate
6.78%
Mortgage Type
Purchase Money Mortgage
Estimated Equity
$741,055
Purchase Details
Closed on
May 7, 2015
Sold by
Fiorentinos Antonios
Bought by
Kajic Almera and Mujevic Ismet
Home Financials for this Owner
Home Financials are based on the most recent Mortgage that was taken out on this home.
Original Mortgage
$696,500
Interest Rate
3.66%
Mortgage Type
Purchase Money Mortgage
Purchase Details
Closed on
Feb 19, 2008
Sold by
Lincoln Management Llc
Bought by
Fiorentinos Antonios
Create a Home Valuation Report for This Property
The Home Valuation Report is an in-depth analysis detailing your home's value as well as a comparison with similar homes in the area
Home Values in the Area
Average Home Value in this Area
Purchase History
| Date | Buyer | Sale Price | Title Company |
|---|---|---|---|
| Aly Amr Z | $1,400,000 | -- | |
| Kajic Almera | $995,000 | -- | |
| Kajic Almera | $995,000 | -- | |
| Fiorentinos Antonios | $804,418 | -- | |
| Fiorentinos Antonios | $804,418 | -- |
Source: Public Records
Mortgage History
| Date | Status | Borrower | Loan Amount |
|---|---|---|---|
| Open | Aly Amr Z | $700,000 | |
| Previous Owner | Kajic Almera | $696,500 |
Source: Public Records
Tax History Compared to Growth
Tax History
| Year | Tax Paid | Tax Assessment Tax Assessment Total Assessment is a certain percentage of the fair market value that is determined by local assessors to be the total taxable value of land and additions on the property. | Land | Improvement |
|---|---|---|---|---|
| 2025 | $10,599 | $52,774 | $5,167 | $47,607 |
| 2024 | $10,599 | $52,772 | $5,427 | $47,345 |
| 2023 | $10,520 | $52,375 | $4,548 | $47,827 |
| 2022 | $9,864 | $93,840 | $8,700 | $85,140 |
| 2021 | $9,810 | $85,020 | $8,700 | $76,320 |
| 2020 | $9,309 | $86,460 | $8,700 | $77,760 |
| 2019 | $9,200 | $89,280 | $8,700 | $80,580 |
| 2018 | $8,897 | $43,646 | $4,044 | $39,602 |
| 2017 | $8,394 | $41,176 | $5,047 | $36,129 |
| 2016 | $7,766 | $41,176 | $5,047 | $36,129 |
| 2015 | $4,685 | $36,648 | $4,256 | $32,392 |
| 2014 | $4,685 | $36,648 | $5,109 | $31,539 |
Source: Public Records
Map
Nearby Homes
- 21-16 77 Street 2nd Floor
- 2003 49th St
- 2007 49th St
- 19-65 79th St Unit 2C
- 20-50 Hazen St
- 21-40 78th St Unit 2
- 20-39 49th St
- 2134 74th St
- 20-21 48th St
- 19-49 80th St
- 21-14 80th St
- 7916 19th Rd Unit 2
- 2061 49th St
- 76-12 Ditmars Blvd Unit B3
- 2208 76th St Unit A3
- 2209 76th St Unit C2
- 21-38 73rd St
- 22-27 76 St Unit B2
- 80-18 19th Ave Unit 1
- 2144 73rd St
- 1979 76th St Unit 2nd floor
- 19-77 76th St
- 1977 76th St
- 7611 21st Ave
- 19-75 76th St Unit 2
- 1975 76th St
- 19-71 76th St Unit 1
- 19-71 76th St
- 1971 76th St
- 19-69 76th St Unit 1
- 1969 76th St
- 1982 77th St
- 1988 77th St
- 19-88 77th St Unit 3
- 19-88 77th St
- 1967 76th St
- 1967 76th St Unit 3
- 1967 76th St Unit 1STFL
- 1967 76th St Unit 2NDFL
- 19-67 76th St