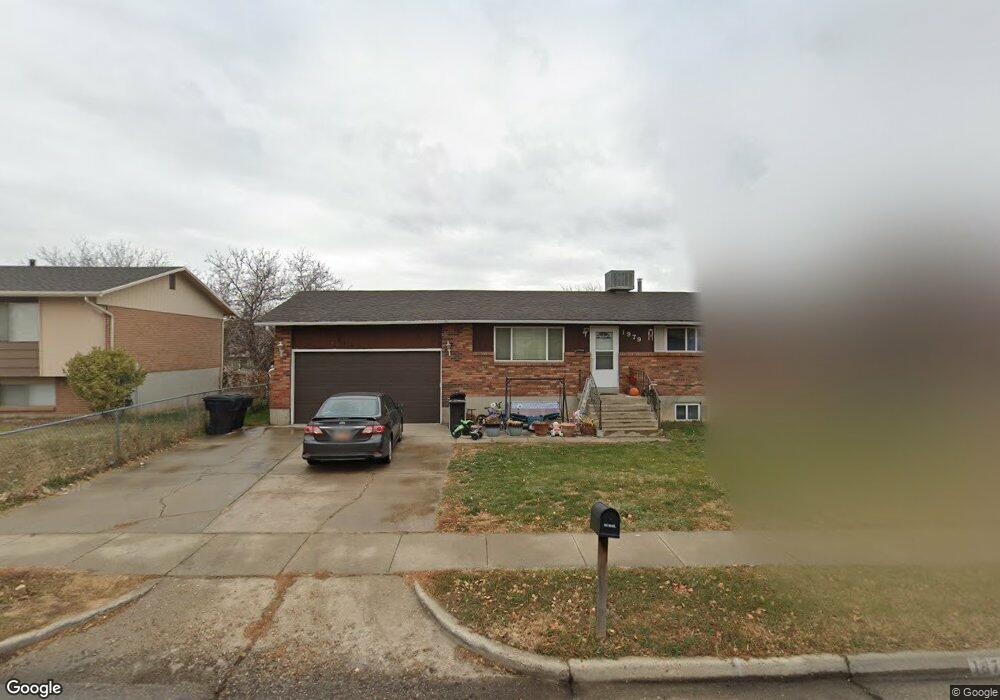
1979 N 630 W Clearfield, UT 84015
Estimated Value: $428,309 - $463,000
5
Beds
2
Baths
1,100
Sq Ft
$403/Sq Ft
Est. Value
About This Home
This home is located at 1979 N 630 W, Clearfield, UT 84015 and is currently estimated at $443,077, approximately $402 per square foot. 1979 N 630 W is a home located in Davis County with nearby schools including Sunset School, Sunset Junior High School, and Northridge High School.
Create a Home Valuation Report for This Property
The Home Valuation Report is an in-depth analysis detailing your home's value as well as a comparison with similar homes in the area
Home Values in the Area
Average Home Value in this Area
Tax History Compared to Growth
Tax History
| Year | Tax Paid | Tax Assessment Tax Assessment Total Assessment is a certain percentage of the fair market value that is determined by local assessors to be the total taxable value of land and additions on the property. | Land | Improvement |
|---|---|---|---|---|
| 2025 | $1,272 | $226,600 | $96,183 | $130,417 |
| 2024 | $1,253 | $222,200 | $105,108 | $117,092 |
| 2023 | $1,139 | $378,000 | $120,669 | $257,331 |
| 2022 | $1,672 | $222,200 | $72,496 | $149,704 |
| 2021 | $1,347 | $298,000 | $92,991 | $205,009 |
| 2020 | $1,075 | $255,000 | $80,222 | $174,778 |
| 2019 | $1,015 | $241,000 | $91,519 | $149,481 |
| 2018 | $911 | $212,000 | $77,014 | $134,986 |
| 2016 | $695 | $95,370 | $30,238 | $65,132 |
| 2015 | $1,278 | $87,450 | $30,238 | $57,212 |
| 2014 | $618 | $87,251 | $30,238 | $57,013 |
| 2013 | -- | $73,200 | $25,230 | $47,970 |
Source: Public Records
Map
Nearby Homes
- 648 W 2200 N
- 2177 N 450 W
- 1746 N 475 W
- 1721 N 400 W
- 1696 N 475 W
- 2382 N 770 W
- 1874 N 200 W
- 36 W 1600 N
- 1438 N 475 W
- 2486 N 690 W
- 1534 N 300 W
- 1974 N 75 W
- 2085 N Main St Unit 409
- 2085 N Main St Unit 108
- 2085 N Main St Unit 401
- 2085 N Main St Unit 308
- 2085 N Main St Unit 116
- 2085 N Main St Unit 201
- 2085 N Main St Unit 402
- 2085 N Main St Unit 202