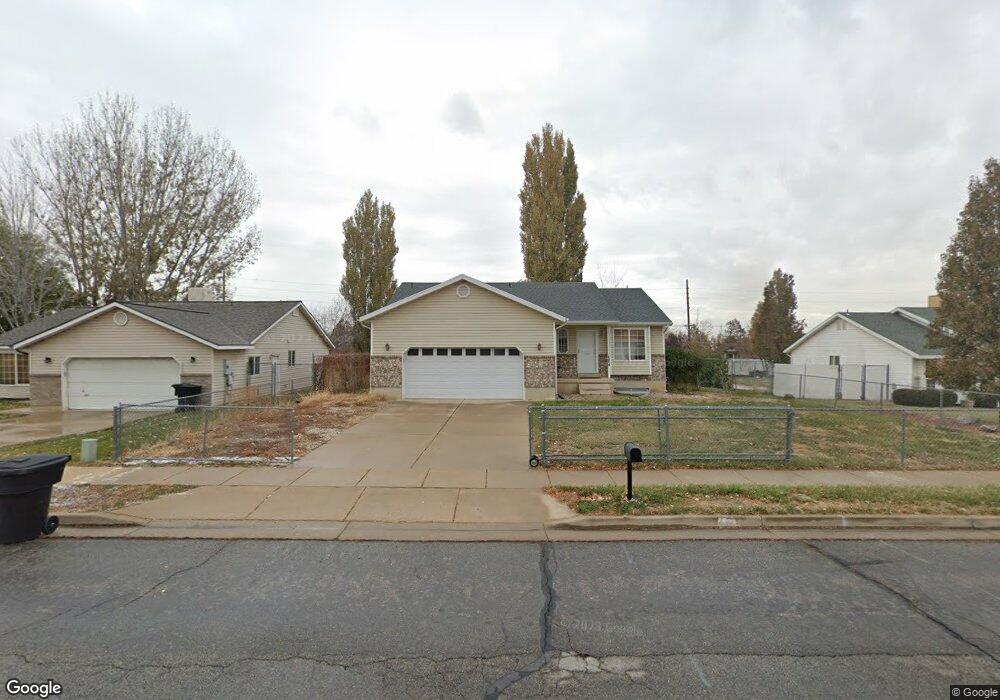
1979 N 950 W Clearfield, UT 84015
Estimated Value: $441,000 - $461,000
2
Beds
2
Baths
2,299
Sq Ft
$196/Sq Ft
Est. Value
About This Home
This home is located at 1979 N 950 W, Clearfield, UT 84015 and is currently estimated at $450,200, approximately $195 per square foot. 1979 N 950 W is a home located in Davis County with nearby schools including Fremont School, Sunset Junior High School, and Northridge High School.
Ownership History
Date
Name
Owned For
Owner Type
Purchase Details
Closed on
Dec 23, 2014
Sold by
Hanley Mccall L and Hanley Marcus
Bought by
Everett Shawn and Everett Jessica
Current Estimated Value
Purchase Details
Closed on
Jul 31, 2012
Sold by
Olsen Steven J and Olsen Jeri L
Bought by
Hanley Mccall L and Hanley Marcus
Home Financials for this Owner
Home Financials are based on the most recent Mortgage that was taken out on this home.
Original Mortgage
$156,186
Interest Rate
3.25%
Mortgage Type
FHA
Purchase Details
Closed on
Nov 2, 2001
Sold by
Olsen Steven J
Bought by
Olsen Steven J and Olsen Jeri L
Home Financials for this Owner
Home Financials are based on the most recent Mortgage that was taken out on this home.
Original Mortgage
$92,000
Interest Rate
6.25%
Purchase Details
Closed on
May 8, 1998
Sold by
Olsen Steven J
Bought by
Olsen Steven J and Holcombe Jeri L
Home Financials for this Owner
Home Financials are based on the most recent Mortgage that was taken out on this home.
Original Mortgage
$93,000
Interest Rate
7.13%
Purchase Details
Closed on
May 1, 1998
Sold by
Holcombe Jeri L
Bought by
Olsen Steven J
Home Financials for this Owner
Home Financials are based on the most recent Mortgage that was taken out on this home.
Original Mortgage
$93,000
Interest Rate
7.13%
Purchase Details
Closed on
Jun 7, 1996
Sold by
Mark Higley Construction Lc
Bought by
Olsen Steven J and Holcombe Jeri L
Home Financials for this Owner
Home Financials are based on the most recent Mortgage that was taken out on this home.
Original Mortgage
$91,200
Interest Rate
7.96%
Purchase Details
Closed on
Feb 12, 1996
Sold by
Higley & Higley Construction Inc
Bought by
Mark Higley Construction Lc
Home Financials for this Owner
Home Financials are based on the most recent Mortgage that was taken out on this home.
Original Mortgage
$67,500
Interest Rate
7.1%
Mortgage Type
Construction
Create a Home Valuation Report for This Property
The Home Valuation Report is an in-depth analysis detailing your home's value as well as a comparison with similar homes in the area
Home Values in the Area
Average Home Value in this Area
Purchase History
| Date | Buyer | Sale Price | Title Company |
|---|---|---|---|
| Everett Shawn | -- | Mountain View Title | |
| Hanley Mccall L | -- | Title One Inc | |
| Olsen Steven J | -- | Associated Title Company | |
| Olsen Steven J | -- | Associated Title Company | |
| Olsen Steven J | -- | Associated Title Company | |
| Olsen Steven J | -- | Associated Title Company | |
| Olsen Steven J | -- | Bonneville Title Company Inc | |
| Mark Higley Construction Lc | -- | Bonneville Title Company Inc |
Source: Public Records
Mortgage History
| Date | Status | Borrower | Loan Amount |
|---|---|---|---|
| Previous Owner | Hanley Mccall L | $156,186 | |
| Previous Owner | Olsen Steven J | $92,000 | |
| Previous Owner | Olsen Steven J | $93,000 | |
| Previous Owner | Olsen Steven J | $91,200 | |
| Previous Owner | Mark Higley Construction Lc | $67,500 |
Source: Public Records
Tax History Compared to Growth
Tax History
| Year | Tax Paid | Tax Assessment Tax Assessment Total Assessment is a certain percentage of the fair market value that is determined by local assessors to be the total taxable value of land and additions on the property. | Land | Improvement |
|---|---|---|---|---|
| 2025 | $2,523 | $242,550 | $92,179 | $150,371 |
| 2024 | $2,418 | $233,750 | $101,135 | $132,615 |
| 2023 | $2,237 | $400,000 | $115,398 | $284,602 |
| 2022 | $2,379 | $235,400 | $70,185 | $165,215 |
| 2021 | $2,160 | $317,000 | $88,547 | $228,453 |
| 2020 | $1,886 | $274,000 | $75,603 | $198,397 |
| 2019 | $1,825 | $259,000 | $87,675 | $171,325 |
| 2018 | $1,664 | $232,000 | $73,966 | $158,034 |
| 2016 | $1,515 | $109,065 | $28,879 | $80,186 |
| 2015 | $1,361 | $93,170 | $28,879 | $64,291 |
| 2014 | $1,333 | $92,686 | $28,879 | $63,807 |
| 2013 | -- | $88,284 | $27,143 | $61,141 |
Source: Public Records
Map
Nearby Homes