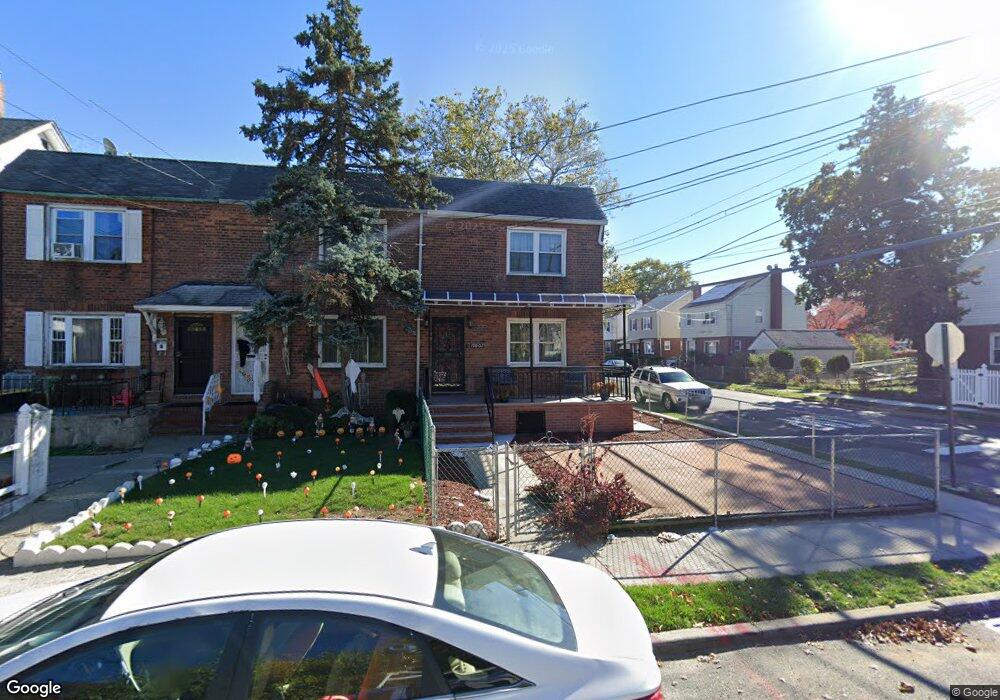
198-02 118th Ave Saint Albans, NY 11412
Saint Albans NeighborhoodEstimated Value: $486,000 - $657,000
2
Beds
2
Baths
918
Sq Ft
$646/Sq Ft
Est. Value
About This Home
This home is located at 198-02 118th Ave, Saint Albans, NY 11412 and is currently estimated at $593,399, approximately $646 per square foot. 198-02 118th Ave is a home located in Queens County with nearby schools including P.S. 136 Roy Wilkins, I.S. 192 The Linden, and Riverton Street Charter School.
Ownership History
Date
Name
Owned For
Owner Type
Purchase Details
Closed on
Oct 11, 2017
Sold by
Rodriguez Rosa
Bought by
Waterberg Patrick A and Wright Charlene M
Current Estimated Value
Home Financials for this Owner
Home Financials are based on the most recent Mortgage that was taken out on this home.
Original Mortgage
$353,479
Outstanding Balance
$294,937
Interest Rate
3.78%
Mortgage Type
Purchase Money Mortgage
Estimated Equity
$298,462
Purchase Details
Closed on
Dec 20, 2002
Sold by
Johnson Tyrone
Bought by
Rodriguez Rosa
Purchase Details
Closed on
Feb 21, 1997
Sold by
Butler Thomas D and Glenn Elizabeth W
Bought by
Johnson Tyrone
Home Financials for this Owner
Home Financials are based on the most recent Mortgage that was taken out on this home.
Original Mortgage
$102,250
Interest Rate
7.55%
Mortgage Type
FHA
Create a Home Valuation Report for This Property
The Home Valuation Report is an in-depth analysis detailing your home's value as well as a comparison with similar homes in the area
Home Values in the Area
Average Home Value in this Area
Purchase History
| Date | Buyer | Sale Price | Title Company |
|---|---|---|---|
| Waterberg Patrick A | $360,000 | -- | |
| Rodriguez Rosa | $210,000 | -- | |
| Johnson Tyrone | $105,000 | -- |
Source: Public Records
Mortgage History
| Date | Status | Borrower | Loan Amount |
|---|---|---|---|
| Open | Waterberg Patrick A | $353,479 | |
| Previous Owner | Johnson Tyrone | $102,250 | |
| Closed | Rodriguez Rosa | $0 |
Source: Public Records
Tax History Compared to Growth
Tax History
| Year | Tax Paid | Tax Assessment Tax Assessment Total Assessment is a certain percentage of the fair market value that is determined by local assessors to be the total taxable value of land and additions on the property. | Land | Improvement |
|---|---|---|---|---|
| 2025 | $4,470 | $23,588 | $5,897 | $17,691 |
| 2024 | $4,470 | $22,253 | $6,671 | $15,582 |
| 2023 | $4,217 | $20,995 | $5,315 | $15,680 |
| 2022 | $4,002 | $29,940 | $8,400 | $21,540 |
| 2021 | $4,218 | $26,520 | $8,400 | $18,120 |
| 2020 | $4,161 | $25,740 | $8,400 | $17,340 |
| 2019 | $3,879 | $22,620 | $8,400 | $14,220 |
| 2018 | $3,567 | $17,496 | $7,204 | $10,292 |
| 2017 | $3,105 | $16,704 | $7,718 | $8,986 |
| 2016 | $3,029 | $16,704 | $7,718 | $8,986 |
| 2015 | $1,681 | $16,381 | $6,880 | $9,501 |
| 2014 | $1,681 | $15,454 | $7,780 | $7,674 |
Source: Public Records
Map
Nearby Homes
- 197-20 118th Ave
- 118-33 199th St
- 118-32 200th St
- 116-42 196th St
- 118-27 201st St
- 200-19 119th Ave
- 11932 197th St
- 118-22 201st
- 11608 196th St
- 117-28 202nd St
- 118 ave 202 St
- 117-02 202nd St
- 193-06 119th Ave
- 200-13 116th Ave
- 120-15 196th St
- 115-47 199th St
- 192-23 116th Rd
- 116-40 203rd St
- 116-39 192nd St
- 194-34 115th Rd
- 19802 118th Ave
- 19802 118th Ave
- 19720 118th Ave
- 19804 118th Ave Unit A
- 19804 118th Ave
- 198-04A118 Avenue
- 19716 118th Ave
- 19716 118th Ave
- 11809 198th St
- 19806 118th Ave
- 11811 198th St
- 19717 118th Ave
- 11814 198th St
- 19712 118th Ave
- 19810 118th Ave
- 11813 198th St
- 19801 118th Ave
- 11815 198th St
- 19708 118th Ave
- 11818 198th St