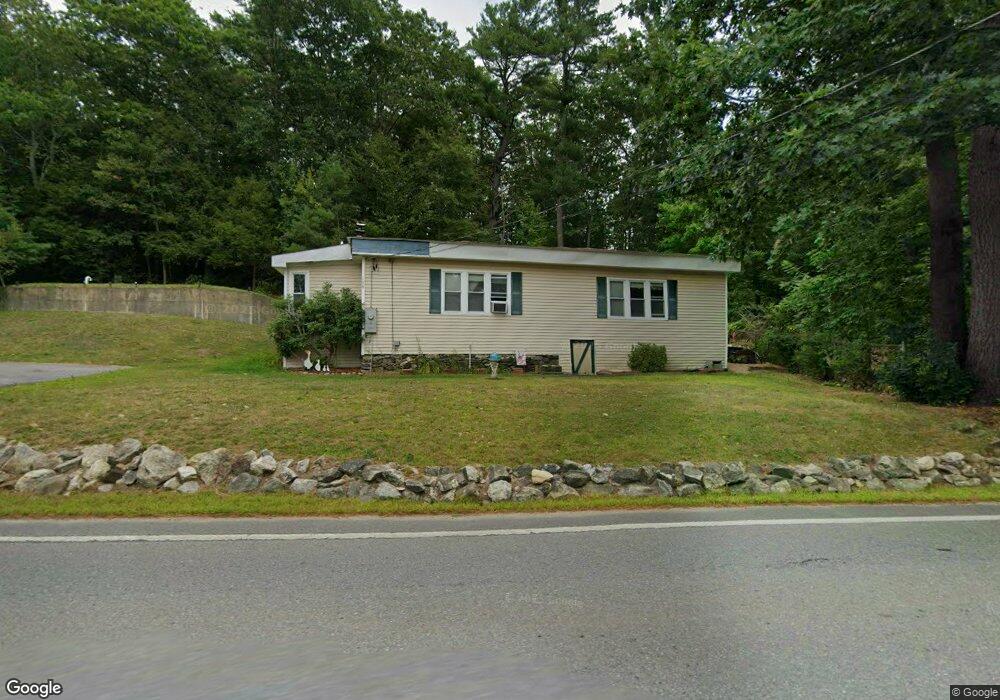
198 Ashby Rd Ashburnham, MA 01430
Estimated Value: $259,000 - $382,000
3
Beds
1
Bath
934
Sq Ft
$358/Sq Ft
Est. Value
About This Home
This home is located at 198 Ashby Rd, Ashburnham, MA 01430 and is currently estimated at $334,585, approximately $358 per square foot. 198 Ashby Rd is a home located in Worcester County with nearby schools including Oakmont Regional High School and Cushing Academy.
Ownership History
Date
Name
Owned For
Owner Type
Purchase Details
Closed on
Jun 11, 2004
Sold by
Valera Charles J
Bought by
Paradis Catherine M and Paradis Richard E
Current Estimated Value
Home Financials for this Owner
Home Financials are based on the most recent Mortgage that was taken out on this home.
Original Mortgage
$144,000
Outstanding Balance
$69,320
Interest Rate
5.99%
Mortgage Type
Purchase Money Mortgage
Estimated Equity
$265,265
Purchase Details
Closed on
Apr 22, 2003
Sold by
Sumner-Moryl Cindy Lou
Bought by
Valera Charles J
Create a Home Valuation Report for This Property
The Home Valuation Report is an in-depth analysis detailing your home's value as well as a comparison with similar homes in the area
Home Values in the Area
Average Home Value in this Area
Purchase History
| Date | Buyer | Sale Price | Title Company |
|---|---|---|---|
| Paradis Catherine M | $180,000 | -- | |
| Paradis Catherine M | $180,000 | -- | |
| Valera Charles J | $55,000 | -- | |
| Valera Charles J | $55,000 | -- |
Source: Public Records
Mortgage History
| Date | Status | Borrower | Loan Amount |
|---|---|---|---|
| Open | Paradis Catherine M | $144,000 | |
| Closed | Valera Charles J | $144,000 | |
| Previous Owner | Valera Charles J | $20,000 | |
| Previous Owner | Valera Charles J | $10,000 |
Source: Public Records
Tax History
| Year | Tax Paid | Tax Assessment Tax Assessment Total Assessment is a certain percentage of the fair market value that is determined by local assessors to be the total taxable value of land and additions on the property. | Land | Improvement |
|---|---|---|---|---|
| 2025 | $3,627 | $243,900 | $32,600 | $211,300 |
| 2024 | $3,563 | $226,200 | $32,600 | $193,600 |
| 2023 | $3,621 | $218,800 | $32,600 | $186,200 |
| 2022 | $3,623 | $191,900 | $32,200 | $159,700 |
| 2021 | $1,817 | $166,900 | $32,200 | $134,700 |
| 2020 | $83 | $166,900 | $32,200 | $134,700 |
| 2019 | $4,975 | $137,600 | $32,200 | $105,400 |
| 2018 | $74 | $131,200 | $30,700 | $100,500 |
| 2017 | $3,037 | $132,200 | $35,700 | $96,500 |
| 2016 | $2,678 | $117,700 | $35,000 | $82,700 |
| 2015 | $2,622 | $117,700 | $35,000 | $82,700 |
Source: Public Records
Map
Nearby Homes
- 152 Ashby Rd
- 57 Ashby Rd
- 0 Rindge Turnpike
- Lot 3 W State Rd
- 10 Central St
- 100 Main St
- 151 Wilker Rd
- 44 Rindge State Rd
- 14 Central St
- 9 Willard Rd
- 2409 W State Rd
- 26 Wellington Rd
- 18 Corey Hill Rd
- 36 Hillandale Rd
- 75 Willard Rd
- 72 Park Rd
- 6 Wyman Rd
- 162 Sherbert Rd
- 137 Deer Bay Rd
- 0 Winding Cove Rd Unit 73431444
Your Personal Tour Guide
Ask me questions while you tour the home.