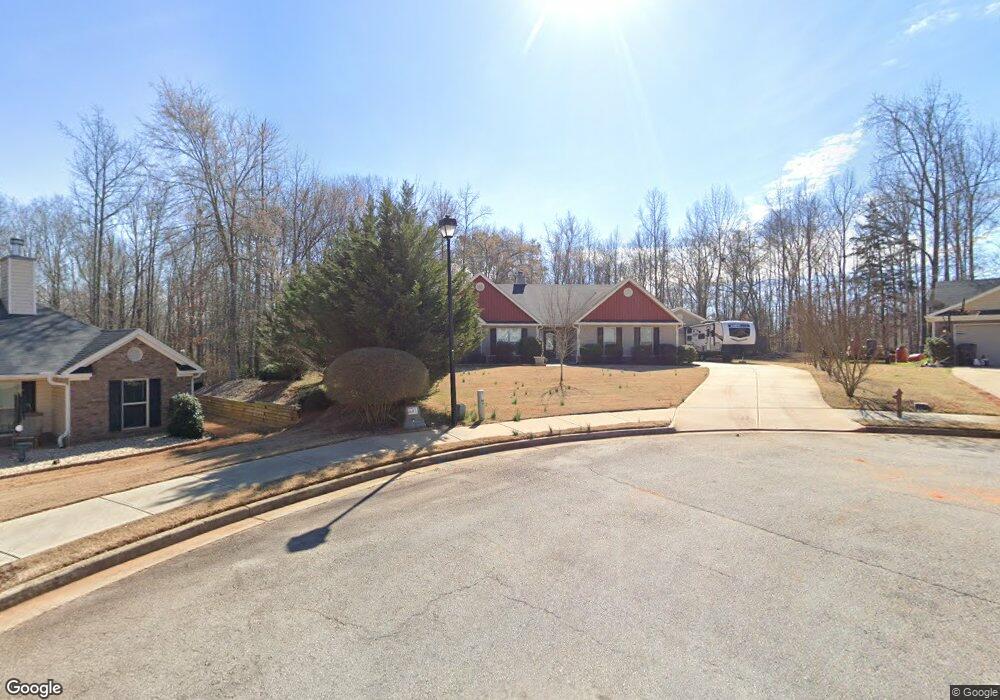
198 Briar Rose Blvd Unit 11 Jefferson, GA 30549
Estimated Value: $375,000 - $472,000
4
Beds
2
Baths
2,250
Sq Ft
$184/Sq Ft
Est. Value
About This Home
This home is located at 198 Briar Rose Blvd Unit 11, Jefferson, GA 30549 and is currently estimated at $413,188, approximately $183 per square foot. 198 Briar Rose Blvd Unit 11 is a home located in Jackson County with nearby schools including South Jackson Elementary School, East Jackson Middle School, and East Jackson Comprehensive High School.
Ownership History
Date
Name
Owned For
Owner Type
Purchase Details
Closed on
Nov 2, 2017
Sold by
Roselots Llc
Bought by
Ledbetter Mark A
Current Estimated Value
Purchase Details
Closed on
Jul 15, 2016
Sold by
Br Homes Llc
Bought by
Shelnutt Larry and Shelnutt Judith
Home Financials for this Owner
Home Financials are based on the most recent Mortgage that was taken out on this home.
Original Mortgage
$194,668
Interest Rate
3.87%
Mortgage Type
FHA
Purchase Details
Closed on
Mar 21, 2016
Sold by
Tdga Llc
Bought by
B R Homes Llc
Purchase Details
Closed on
Oct 25, 2013
Sold by
American Home Real Estate
Bought by
Tdga Llc
Purchase Details
Closed on
Oct 2, 2012
Sold by
Elrod Donald T
Bought by
The American Home Real Estate
Purchase Details
Closed on
Jul 3, 2012
Sold by
Norris Billy
Bought by
Roselots Llc
Purchase Details
Closed on
Jun 10, 2006
Sold by
Not Provided
Bought by
Norris Billy
Create a Home Valuation Report for This Property
The Home Valuation Report is an in-depth analysis detailing your home's value as well as a comparison with similar homes in the area
Home Values in the Area
Average Home Value in this Area
Purchase History
| Date | Buyer | Sale Price | Title Company |
|---|---|---|---|
| Ledbetter Mark A | $500 | -- | |
| Shelnutt Larry | $198,300 | -- | |
| B R Homes Llc | $36,500 | -- | |
| Tdga Llc | $99,125 | -- | |
| The American Home Real Estate | $2,750 | -- | |
| Roselots Llc | -- | -- | |
| Norris Billy | $592,350 | -- |
Source: Public Records
Mortgage History
| Date | Status | Borrower | Loan Amount |
|---|---|---|---|
| Previous Owner | Shelnutt Larry | $194,668 |
Source: Public Records
Tax History Compared to Growth
Tax History
| Year | Tax Paid | Tax Assessment Tax Assessment Total Assessment is a certain percentage of the fair market value that is determined by local assessors to be the total taxable value of land and additions on the property. | Land | Improvement |
|---|---|---|---|---|
| 2024 | $3,684 | $144,760 | $18,000 | $126,760 |
| 2023 | $3,684 | $130,640 | $18,000 | $112,640 |
| 2022 | $2,851 | $98,320 | $8,800 | $89,520 |
| 2021 | $2,871 | $98,320 | $8,800 | $89,520 |
| 2020 | $2,602 | $81,440 | $8,800 | $72,640 |
| 2019 | $2,640 | $81,440 | $8,800 | $72,640 |
| 2018 | $2,577 | $78,400 | $8,800 | $69,600 |
| 2017 | $2,539 | $76,594 | $8,800 | $67,794 |
| 2016 | $186 | $3,200 | $3,200 | $0 |
| 2015 | $186 | $3,200 | $3,200 | $0 |
| 2014 | $187 | $3,200 | $3,200 | $0 |
| 2013 | -- | $3,200 | $3,200 | $0 |
Source: Public Records
Map
Nearby Homes
- 261 Petal Creek Ln
- 0 Berch Tree Trail Unit LOT 12
- 0 Berch Tree Trail Unit LOT 7
- 1094 B Whitfield Rd
- 582 B Whitfield Rd
- 37 Carruth Rd
- 126 Old Indian Trail
- 70 Feldspar Dr
- 385 Feldspar Dr
- 77 Lakeview Ct
- 3845 S Highway 82
- 207 Cedar Grove Church Rd
- 2081 Ethridge Rd
- 808 Rock Forge Rd
- 670 Cedar Grove Church Rd
- 670 Cedar Grove Church Rd
- 1955 Paynes Point
- 2200 Lebanon Church Lot 3 Rd
- 198 Briar Rose Blvd
- 180 Briar Rose Blvd Unit 10
- 180 Briar Rose Blvd
- 195 Briar Rose Blvd
- 195 Briar Rose Blvd Unit 12
- 162 Briar Rose Blvd
- 162 Briar Rose Blvd Unit 9
- 159 Briar Rose Blvd Unit 13
- 159 Briar Rose Blvd
- 144 Briar Rose Blvd Unit 8
- 144 Briar Rose Blvd
- 141 Briar Rose Blvd Unit 14
- 141 Briar Rose Blvd
- 126 Briar Rose Blvd Unit 7
- 126 Briar Rose Blvd
- 123 Briar Rose Blvd Unit 15
- 123 Briar Rose Blvd
- 108 Briar Rose Blvd Unit 6
- 108 Briar Rose Blvd
- 105 Briar Rose Blvd Unit 16