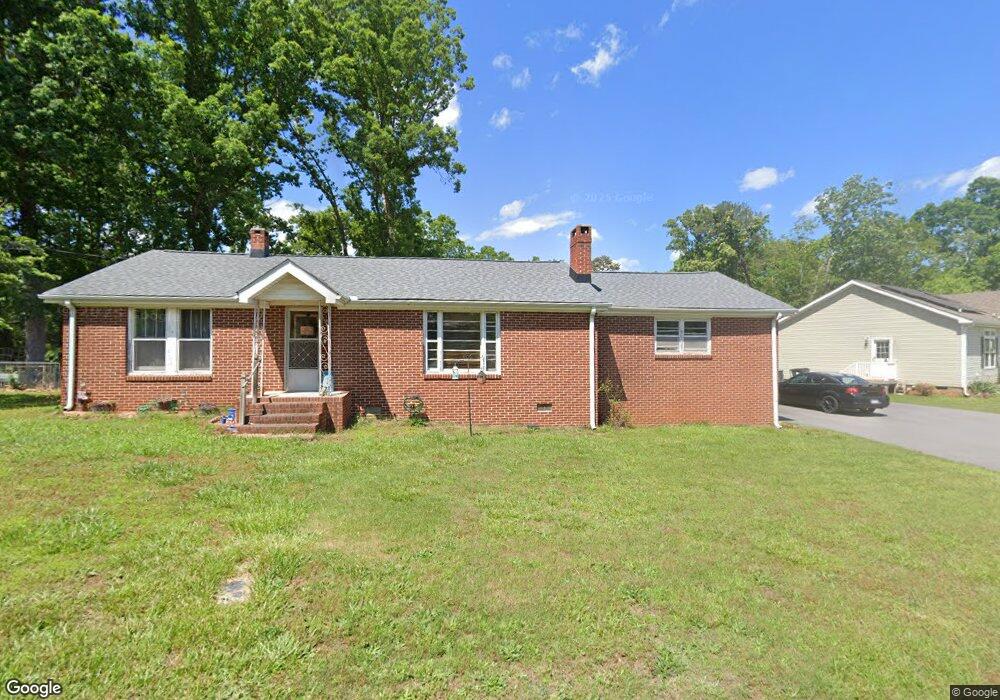
198 Floyd Cir Easley, SC 29640
Estimated Value: $151,253 - $224,000
2
Beds
1
Bath
1,185
Sq Ft
$159/Sq Ft
Est. Value
About This Home
This home is located at 198 Floyd Cir, Easley, SC 29640 and is currently estimated at $188,313, approximately $158 per square foot. 198 Floyd Cir is a home located in Pickens County with nearby schools including Crosswell Elementary School, Richard H. Gettys Middle School, and Easley High School.
Ownership History
Date
Name
Owned For
Owner Type
Purchase Details
Closed on
Jul 30, 2010
Sold by
Homestead Options Llc
Bought by
Kreider Joseph R and Moman Sandra
Current Estimated Value
Home Financials for this Owner
Home Financials are based on the most recent Mortgage that was taken out on this home.
Original Mortgage
$66,997
Outstanding Balance
$43,891
Interest Rate
4.75%
Mortgage Type
FHA
Estimated Equity
$144,422
Purchase Details
Closed on
Jan 20, 2010
Sold by
Federal Home Loan Mortgage Corporation
Bought by
Homestead Options Llc
Purchase Details
Closed on
Oct 26, 2009
Sold by
Mcabee Kenneth L
Bought by
Federal Home Loan Mortgage Corp
Purchase Details
Closed on
Jun 1, 2007
Sold by
Adams Eunice D and Alexander Brenda Adams
Bought by
Mcabee Kenneth L
Home Financials for this Owner
Home Financials are based on the most recent Mortgage that was taken out on this home.
Original Mortgage
$72,900
Interest Rate
6.12%
Create a Home Valuation Report for This Property
The Home Valuation Report is an in-depth analysis detailing your home's value as well as a comparison with similar homes in the area
Home Values in the Area
Average Home Value in this Area
Purchase History
| Date | Buyer | Sale Price | Title Company |
|---|---|---|---|
| Kreider Joseph R | $67,900 | -- | |
| Homestead Options Llc | $36,900 | -- | |
| Federal Home Loan Mortgage Corp | $60,600 | -- | |
| Mcabee Kenneth L | $72,900 | Attorney |
Source: Public Records
Mortgage History
| Date | Status | Borrower | Loan Amount |
|---|---|---|---|
| Open | Kreider Joseph R | $66,997 | |
| Previous Owner | Mcabee Kenneth L | $72,900 |
Source: Public Records
Tax History
| Year | Tax Paid | Tax Assessment Tax Assessment Total Assessment is a certain percentage of the fair market value that is determined by local assessors to be the total taxable value of land and additions on the property. | Land | Improvement |
|---|---|---|---|---|
| 2025 | $383 | $3,470 | $460 | $3,010 |
| 2024 | $383 | $3,020 | $400 | $2,620 |
| 2023 | $363 | $3,020 | $400 | $2,620 |
| 2022 | $365 | $3,020 | $400 | $2,620 |
| 2021 | $390 | $3,020 | $400 | $2,620 |
| 2020 | $418 | $3,016 | $400 | $2,616 |
| 2019 | $425 | $3,020 | $400 | $2,620 |
| 2018 | $389 | $2,640 | $400 | $2,240 |
| 2017 | $381 | $2,640 | $400 | $2,240 |
| 2015 | $373 | $2,640 | $0 | $0 |
| 2008 | -- | $4,370 | $600 | $3,770 |
Source: Public Records
Map
Nearby Homes
- 609 N Fishtrap Rd
- 109 Riverview Dr
- 152 Cedar Shoals Ct
- 124 Habu Ct Unit Homesite 6
- 122 Habu Ct Unit Homesite 7
- 118 Habu Ct Unit Homesite 9
- 114 Habu Ct Unit Homesite 11
- 105 Habu Ct Unit Homesite 1
- 17 Riverview Cir
- 144 Evelyn Rd
- 1010 Old Easley Hwy
- 4120 Calhoun Memorial Hwy Unit 4120 Highway 123 N
- 123 Bobbin Rd
- 103 & 493 Quail Haven & Odom Road Dr
- 103 Quail Haven Dr Unit 493 Odom Road
- 79 Topsail Ct
- 61 Topsail Ct
- 1712 E Saluda Lake Rd
- 1706 E Saluda Lake Rd
- 1618 E Saluda Lake Rd
- 00 Floyd Cir
- 0 Floyd Cir
- 208 Floyd Cir
- 195 Floyd Cir
- 184 Floyd Cir
- 105 Broome Ln
- 180 Floyd Cir
- 169 Floyd Cir
- 510 N Fishtrap Rd
- 102 Broome Ln
- 135 Floyd Cir
- 176 Floyd Cir
- 122 Broome Ln
- 420 N Fishtrap Rd
- 420 Fish Trap Rd
- 0 N Fishtrap Rd Unit Hwy 124 20164905
- 0 N Fishtrap Rd Unit 20180817
- 0000 N Fishtrap Rd
- 0 N Fish Trap Rd Unit 1161184
- 0 N Fish Trap Rd Unit 1348307
Your Personal Tour Guide
Ask me questions while you tour the home.