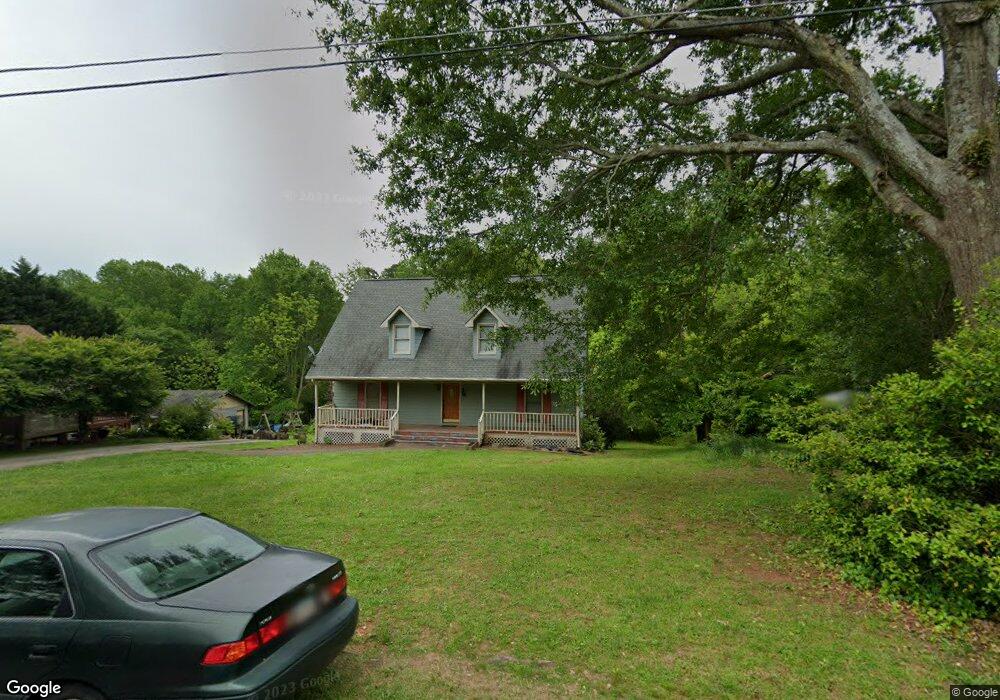
198 Hickory Ave Unit 18&19 Demorest, GA 30535
Estimated Value: $208,000 - $279,386
3
Beds
3
Baths
1,524
Sq Ft
$155/Sq Ft
Est. Value
About This Home
This home is located at 198 Hickory Ave Unit 18&19, Demorest, GA 30535 and is currently estimated at $235,847, approximately $154 per square foot. 198 Hickory Ave Unit 18&19 is a home located in Habersham County with nearby schools including Demorest Elementary School, Wilbanks Middle School, and Habersham Success Academy.
Ownership History
Date
Name
Owned For
Owner Type
Purchase Details
Closed on
Jul 1, 2025
Sold by
Bowman Steve Alex
Bought by
Wilson Lukas and Zavala David
Current Estimated Value
Purchase Details
Closed on
Jul 15, 2015
Sold by
Kimbrell Kimberly Ann Thra
Bought by
Bowman Steve Alex
Home Financials for this Owner
Home Financials are based on the most recent Mortgage that was taken out on this home.
Original Mortgage
$115,510
Interest Rate
4.04%
Mortgage Type
New Conventional
Purchase Details
Closed on
Jul 2, 2015
Sold by
Kimbrell Donald Jeffrey
Bought by
Kimbrell Kimberly Ann Thrasher
Home Financials for this Owner
Home Financials are based on the most recent Mortgage that was taken out on this home.
Original Mortgage
$115,510
Interest Rate
4.04%
Mortgage Type
New Conventional
Create a Home Valuation Report for This Property
The Home Valuation Report is an in-depth analysis detailing your home's value as well as a comparison with similar homes in the area
Home Values in the Area
Average Home Value in this Area
Purchase History
| Date | Buyer | Sale Price | Title Company |
|---|---|---|---|
| Wilson Lukas | $202,000 | -- | |
| Bowman Steve Alex | $110,000 | -- | |
| Kimbrell Kimberly Ann Thrasher | -- | -- |
Source: Public Records
Mortgage History
| Date | Status | Borrower | Loan Amount |
|---|---|---|---|
| Previous Owner | Bowman Steve Alex | $115,510 | |
| Previous Owner | Kimbrell Kimberly Ann Thrasher | $115,510 |
Source: Public Records
Tax History Compared to Growth
Tax History
| Year | Tax Paid | Tax Assessment Tax Assessment Total Assessment is a certain percentage of the fair market value that is determined by local assessors to be the total taxable value of land and additions on the property. | Land | Improvement |
|---|---|---|---|---|
| 2025 | $3,136 | $100,133 | $13,300 | $86,833 |
| 2024 | $2,363 | $91,052 | $9,500 | $81,552 |
| 2023 | $1,924 | $76,964 | $9,500 | $67,464 |
| 2022 | $1,708 | $65,492 | $7,600 | $57,892 |
| 2021 | $1,519 | $58,524 | $6,840 | $51,684 |
| 2020 | $1,348 | $50,132 | $5,700 | $44,432 |
| 2019 | $1,350 | $50,132 | $5,700 | $44,432 |
| 2018 | $1,314 | $49,184 | $4,752 | $44,432 |
| 2017 | $1,190 | $44,300 | $3,800 | $40,500 |
| 2016 | $1,147 | $110,000 | $3,800 | $40,200 |
| 2015 | $1,036 | $100,480 | $3,800 | $36,392 |
| 2014 | $1,030 | $98,080 | $3,800 | $35,432 |
| 2013 | -- | $39,232 | $3,800 | $35,432 |
Source: Public Records
Map
Nearby Homes
- 198 Hickory Ave
- 107 Brasstown Ln
- 189 Legacy Dr
- 110 Bridgeport Dr
- 536 Wauka Dr
- 544 Wauka Dr
- Plan 2131 at Habersham Meadows
- Plan 1709 at Habersham Meadows
- Plan 2307 at Habersham Meadows
- Plan 1902 at Habersham Meadows
- Plan 3119 at Habersham Meadows
- Plan 2408 at Habersham Meadows
- Plan 2100 at Habersham Meadows
- Plan 2628 at Habersham Meadows
- Plan 3105 at Habersham Meadows
- Plan 2121 at Habersham Meadows
- Plan 1602-2 at Habersham Meadows
- Plan 1643 at Habersham Meadows
- 515 Wauka Dr
- 545 Wauka Dr
- 198 Hickory Ave Unit 18
- 220 Hickory Ave
- 187 Hickory Ave
- 244 Hickory Ave
- 229 Hickory Ave
- 315 Chestnut Ave
- 156 Hickory Ave
- 141 Hickory Ave
- 141 Nevada St
- 257 Hickory Ave
- 260 Hickory Ave
- 125 Nevada St
- 125 Hickory Ave
- 317 Chestnut Ave
- 141 Nevada St
- 274 Hickory Ave Unit 4
- 274 Hickory Ave
- 110 Nevada St
- 118 Hickory Ave Unit 143
- 197 Chestnut Ave Unit 11