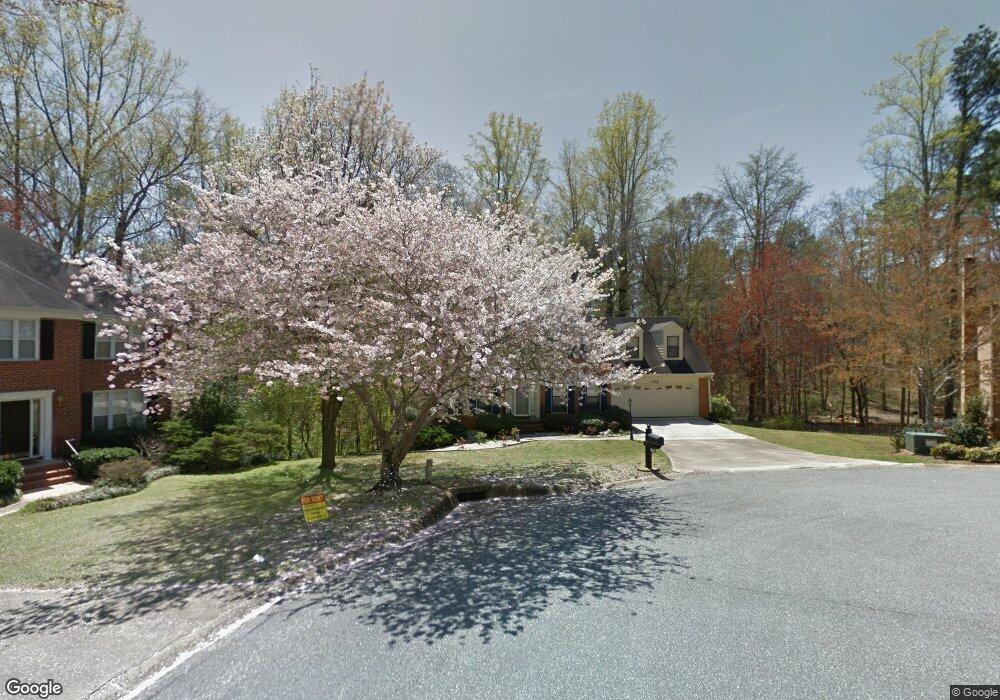
198 Lenox Place Athens, GA 30606
Kingswood NeighborhoodEstimated Value: $428,082 - $561,000
--
Bed
1
Bath
2,756
Sq Ft
$188/Sq Ft
Est. Value
About This Home
This home is located at 198 Lenox Place, Athens, GA 30606 and is currently estimated at $517,021, approximately $187 per square foot. 198 Lenox Place is a home located in Clarke County with nearby schools including Timothy Elementary School, Clarke Middle School, and Clarke Central High School.
Ownership History
Date
Name
Owned For
Owner Type
Purchase Details
Closed on
Jun 17, 2004
Sold by
Seymour J Allen
Bought by
Seymour Catherine E
Current Estimated Value
Purchase Details
Closed on
Jun 16, 2004
Sold by
Seymour Catherine E
Bought by
Seymour Catherine E and Allen Seymo J
Purchase Details
Closed on
May 14, 2004
Sold by
Seymour J Allen
Bought by
Seymour Catherine E
Purchase Details
Closed on
May 13, 2004
Sold by
Seymour Catherine E
Bought by
Seymour J Allen
Purchase Details
Closed on
Jul 15, 1999
Sold by
Seymour Catherine E
Bought by
Seymour Catherine E and Allen Seymo J
Purchase Details
Closed on
Sep 26, 1996
Sold by
Seymour Catherine E and Allen Seymour J
Bought by
Seymour Catherine E
Purchase Details
Closed on
Feb 18, 1994
Sold by
Seymour James Allen
Bought by
Seymour Catherine E and Allen Seymo J
Purchase Details
Closed on
Jun 19, 1989
Sold by
Rod Wright J and Rod Wright
Bought by
Seymour James Allen and Seymour Catherine E
Create a Home Valuation Report for This Property
The Home Valuation Report is an in-depth analysis detailing your home's value as well as a comparison with similar homes in the area
Home Values in the Area
Average Home Value in this Area
Purchase History
| Date | Buyer | Sale Price | Title Company |
|---|---|---|---|
| Seymour Catherine E | -- | -- | |
| Seymour Catherine E | -- | -- | |
| Seymour Catherine E | -- | -- | |
| Seymour J Allen | -- | -- | |
| Seymour Catherine E | -- | -- | |
| Seymour Catherine E | -- | -- | |
| Seymour Catherine E | -- | -- | |
| Seymour James Allen | -- | -- | |
| Seymour James Allen | $146,000 | -- |
Source: Public Records
Tax History Compared to Growth
Tax History
| Year | Tax Paid | Tax Assessment Tax Assessment Total Assessment is a certain percentage of the fair market value that is determined by local assessors to be the total taxable value of land and additions on the property. | Land | Improvement |
|---|---|---|---|---|
| 2025 | $3,800 | $197,271 | $16,000 | $181,271 |
| 2024 | $3,800 | $182,180 | $16,000 | $166,180 |
| 2023 | $3,832 | $171,669 | $16,000 | $155,669 |
| 2022 | $3,621 | $143,323 | $16,000 | $127,323 |
| 2021 | $3,505 | $120,230 | $16,000 | $104,230 |
| 2020 | $3,361 | $109,732 | $16,000 | $93,732 |
| 2019 | $3,329 | $108,042 | $16,000 | $92,042 |
| 2018 | $3,104 | $101,426 | $16,000 | $85,426 |
| 2017 | $3,142 | $102,541 | $16,000 | $86,541 |
| 2016 | $3,075 | $100,577 | $14,000 | $86,577 |
| 2015 | $2,977 | $97,532 | $14,000 | $83,532 |
| 2014 | $2,817 | $92,721 | $14,000 | $78,721 |
Source: Public Records
Map
Nearby Homes
- 199 Lenox Place
- 188 Lenox Place
- 168 Lenox Place
- 189 Lenox Place
- 179 Lenox Place
- 163 Holly Hills Dr
- 169 Holly Hills Dr
- 157 Holly Hills Dr
- 169 Lenox Place
- 148 Lenox Place
- 175 Holly Hills Dr
- 0 Holly Hills Dr Unit 7000742
- 0 Holly Hills Dr
- 149 Lenox Place
- 149 Lenox Place
- 101 Canterbury Dr
- 151 Holly Hills Dr
- 105 Canterbury Dr
- 0 Lenox Place Unit 8560792
- 0 Lenox Place Unit 8401916