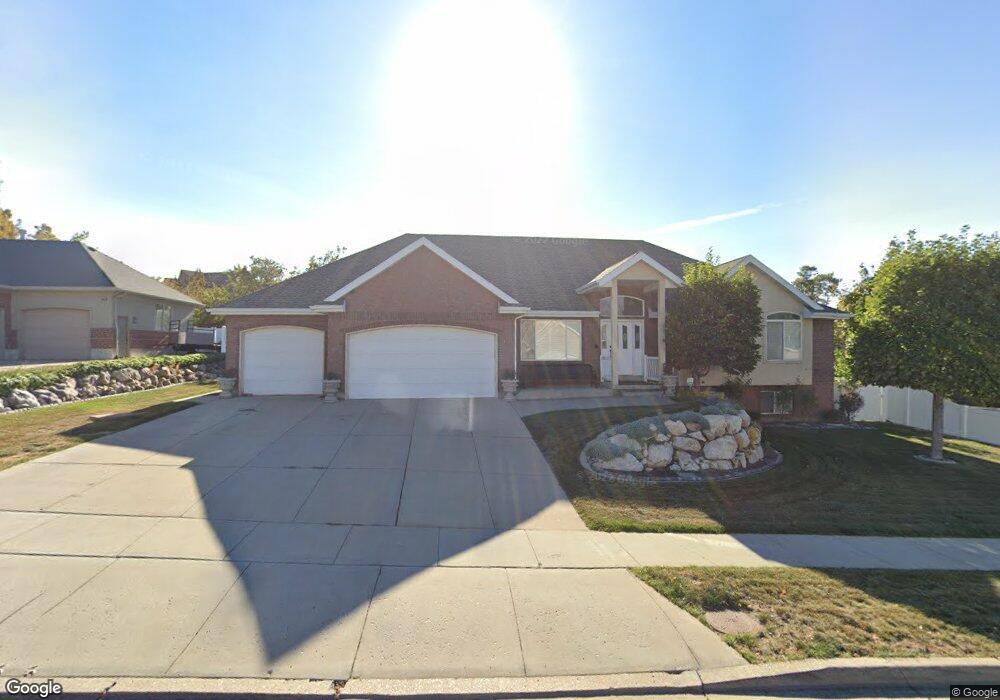
198 N Canyon Rd Bountiful, UT 84010
Estimated Value: $786,000 - $1,108,000
6
Beds
4
Baths
4,050
Sq Ft
$216/Sq Ft
Est. Value
About This Home
This home is located at 198 N Canyon Rd, Bountiful, UT 84010 and is currently estimated at $876,520, approximately $216 per square foot. 198 N Canyon Rd is a home located in Davis County with nearby schools including Muir School, Mueller Park Junior High School, and Woods Cross High School.
Ownership History
Date
Name
Owned For
Owner Type
Purchase Details
Closed on
Jun 2, 2005
Sold by
Pituckul Prapun
Bought by
Pituckul Prapun and Pituckul Songsri
Current Estimated Value
Home Financials for this Owner
Home Financials are based on the most recent Mortgage that was taken out on this home.
Original Mortgage
$100,000
Interest Rate
5.74%
Mortgage Type
Fannie Mae Freddie Mac
Purchase Details
Closed on
Oct 16, 2001
Sold by
Nordstrom Barbara A
Bought by
Nordstrom Barbara A
Purchase Details
Closed on
Jun 21, 2001
Sold by
Anderson Homes Lc
Bought by
Nordstrom Barbara A
Purchase Details
Closed on
Jul 27, 2000
Sold by
Foss Lewis Associates Lc
Bought by
Anderson Homes Lc
Home Financials for this Owner
Home Financials are based on the most recent Mortgage that was taken out on this home.
Original Mortgage
$72,350
Interest Rate
8.2%
Mortgage Type
Construction
Create a Home Valuation Report for This Property
The Home Valuation Report is an in-depth analysis detailing your home's value as well as a comparison with similar homes in the area
Purchase History
We collect this data history from publicly available records. To have your information removed, we recommend requesting removal directly through your county’s website.
| Date | Buyer | Sale Price | Title Company |
|---|---|---|---|
| Pituckul Prapun | -- | Backman Stewart Title Svcs | |
| Pituckul Prapun | -- | Equity Title Ins Agency Inc | |
| Nordstrom Barbara A | -- | -- | |
| Nordstrom Barbara A | -- | Western States Title Company | |
| Anderson Homes Lc | -- | Aspen Title Insurance Agency |
Source: Public Records
Mortgage History
We collect this data history from publicly available records. To have your information removed, we recommend requesting removal directly through your county’s website.
| Date | Status | Borrower | Loan Amount |
|---|---|---|---|
| Closed | Pituckul Prapun | $100,000 | |
| Previous Owner | Anderson Homes Lc | $72,350 |
Source: Public Records
Tax History
| Year | Tax Paid | Tax Assessment Tax Assessment Total Assessment is a certain percentage of the fair market value that is determined by local assessors to be the total taxable value of land and additions on the property. | Land | Improvement |
|---|---|---|---|---|
| 2025 | $4,357 | $407,000 | $142,330 | $264,670 |
| 2024 | $4,270 | $405,900 | $131,094 | $274,806 |
| 2023 | $3,993 | $684,000 | $239,460 | $444,540 |
| 2022 | $3,981 | $379,500 | $127,757 | $251,743 |
| 2021 | $3,655 | $534,000 | $190,034 | $343,966 |
| 2020 | $3,380 | $497,000 | $172,997 | $324,003 |
| 2019 | $3,606 | $523,000 | $166,512 | $356,488 |
| 2018 | $3,411 | $488,000 | $155,205 | $332,795 |
| 2016 | $3,032 | $242,385 | $51,148 | $191,237 |
| 2015 | $3,142 | $235,125 | $51,148 | $183,977 |
| 2014 | $2,625 | $202,976 | $51,148 | $151,828 |
| 2013 | -- | $205,401 | $67,892 | $137,509 |
Source: Public Records
Map
Nearby Homes
- 298 E North Canyon Rd
- 166 E 3000 S
- 101 W 2800 S
- 221 E 2450 S
- 110 2250 S
- 610 Meadowlark Ln
- 424 E Canyon Estates Dr S
- 11 E Bonneville Dr
- 3345 Canyon Estates Dr
- 2512 S 150 W
- 2170 Orchard Pines Loop E
- 320 E 2100 S
- 41 E 2200 S
- 2183 Penman Ln
- 296 E 2050 S Unit 2
- 337 W 2900 S
- 2046 S 350 E Unit 4
- 295 E 2050 S Unit 1
- 3551 S Huntington Dr
- 2038 S 350 E Unit 3
- 198 E North Canyon Rd
- 212 E North Canyon Rd
- 182 E North Canyon Rd
- 170 E North Canyon Rd
- 2760 Irene Dr
- 205 E North Canyon Rd
- 180 E North Canyon Rd
- 226 E North Canyon Rd
- 195 E North Canyon Rd
- 2783 Irene Dr
- 2809 S 150 E
- 2752 Irene Dr
- 230 Lewis Park Cir
- 240 E North Canyon Rd
- 2743 S Davis Blvd
- 2829 S 150 E
- 2727 S Davis Blvd
- 179 E North Canyon Rd
- 196 E North Canyon Rd
- 251 E North Canyon Rd
Your Personal Tour Guide
Ask me questions while you tour the home.