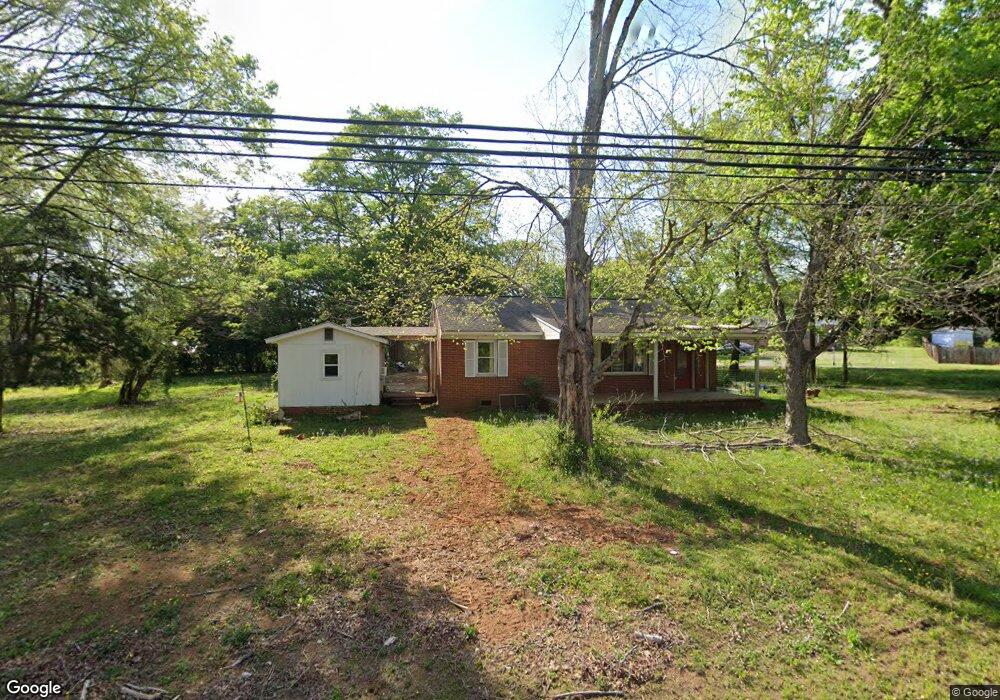
198 Nc Highway 902 Pittsboro, NC 27312
Estimated Value: $277,000 - $306,000
2
Beds
1
Bath
888
Sq Ft
$327/Sq Ft
Est. Value
About This Home
This home is located at 198 Nc Highway 902, Pittsboro, NC 27312 and is currently estimated at $290,054, approximately $326 per square foot. 198 Nc Highway 902 is a home located in Chatham County with nearby schools including Pittsboro Elementary School, George Moses Horton Middle School, and Northwood High.
Ownership History
Date
Name
Owned For
Owner Type
Purchase Details
Closed on
Feb 21, 2024
Sold by
Parks Thomas Frederick and Parks Jessica Camp
Bought by
Davis Samuel Harrison
Current Estimated Value
Home Financials for this Owner
Home Financials are based on the most recent Mortgage that was taken out on this home.
Original Mortgage
$271,600
Outstanding Balance
$266,524
Interest Rate
6.6%
Mortgage Type
New Conventional
Estimated Equity
$23,530
Purchase Details
Closed on
Aug 26, 2019
Sold by
Starr Lindsay E and Starr Jonathan
Bought by
Campbell Parks Ii Thomas Frederick and Campbell Parks Jessica
Purchase Details
Closed on
Jul 5, 2007
Sold by
Starr Jonathan and Starr Lindsay
Bought by
Jonathan & Lindsay Starr Living Trust
Create a Home Valuation Report for This Property
The Home Valuation Report is an in-depth analysis detailing your home's value as well as a comparison with similar homes in the area
Home Values in the Area
Average Home Value in this Area
Purchase History
| Date | Buyer | Sale Price | Title Company |
|---|---|---|---|
| Davis Samuel Harrison | $280,000 | None Listed On Document | |
| Campbell Parks Ii Thomas Frederick | $140,000 | None Available | |
| Starr Lindsay E | -- | None Available | |
| Jonathan & Lindsay Starr Living Trust | -- | None Available |
Source: Public Records
Mortgage History
| Date | Status | Borrower | Loan Amount |
|---|---|---|---|
| Open | Davis Samuel Harrison | $271,600 |
Source: Public Records
Tax History Compared to Growth
Tax History
| Year | Tax Paid | Tax Assessment Tax Assessment Total Assessment is a certain percentage of the fair market value that is determined by local assessors to be the total taxable value of land and additions on the property. | Land | Improvement |
|---|---|---|---|---|
| 2025 | $3,146 | $255,377 | $57,680 | $197,697 |
| 2024 | $3,146 | $154,731 | $43,260 | $111,471 |
| 2023 | $2,273 | $154,731 | $43,260 | $111,471 |
| 2022 | $2,130 | $154,731 | $43,260 | $111,471 |
| 2021 | $2,099 | $154,731 | $43,260 | $111,471 |
| 2020 | $1,619 | $111,361 | $36,000 | $75,361 |
| 2019 | $1,599 | $111,361 | $36,000 | $75,361 |
| 2018 | $1,512 | $111,361 | $36,000 | $75,361 |
| 2017 | $1,512 | $111,361 | $36,000 | $75,361 |
| 2016 | $1,454 | $105,361 | $30,000 | $75,361 |
| 2015 | $1,442 | $105,361 | $30,000 | $75,361 |
| 2014 | -- | $105,361 | $30,000 | $75,361 |
| 2013 | -- | $105,361 | $30,000 | $75,361 |
Source: Public Records
Map
Nearby Homes
- 0 N Carolina 902
- 00 N Carolina 902
- 507 W Salisbury St
- 000 Alston Chapel Rd
- 248 Ashford Dr
- 162 Gaines Trail
- 425 Credle St
- 0 Nc 87 Hwy Unit 2491586
- 230 Oakwood Dr
- 66 Toomer Loop Rd
- 298 E Salisbury St
- 15 Juniper Ct
- 116 Kensington Dr
- 341 Windsong Dr
- Tbd Versailles Ln
- 344 May Farm Rd
- 54 Pattishall Rd
- 74 Brookridge Ct
- 24 Cynthia Ln
- 726 Thompson St
- 198 Nc Highway 902 Unit 1
- 198 N Carolina 902
- 198 N Carolina 902 Unit 1
- 226 Old Goldston Rd
- 3401 N Carolina 87
- 3457 N Carolina 87
- 5534 N Carolina 87
- 3401 N Carolina 87 Unit 3401 NC Highway 87 N
- 3457 N Carolina 87 Unit 3457 NC Highway 87 N
- 242 Nc Highway 902
- 6155 N Carolina 87
- 47 Old Goldston Rd
- 30 Old Goldston Rd Unit A
- 30 Old Goldston Rd Unit B
- 30 Old Goldston Rd Unit B-1
- 30 Old Goldston Rd Unit B2
- 30 Old Goldston Rd
- 152 N Carolina 902
- 152 Nc Highway 902
- 65 Old Goldston Rd