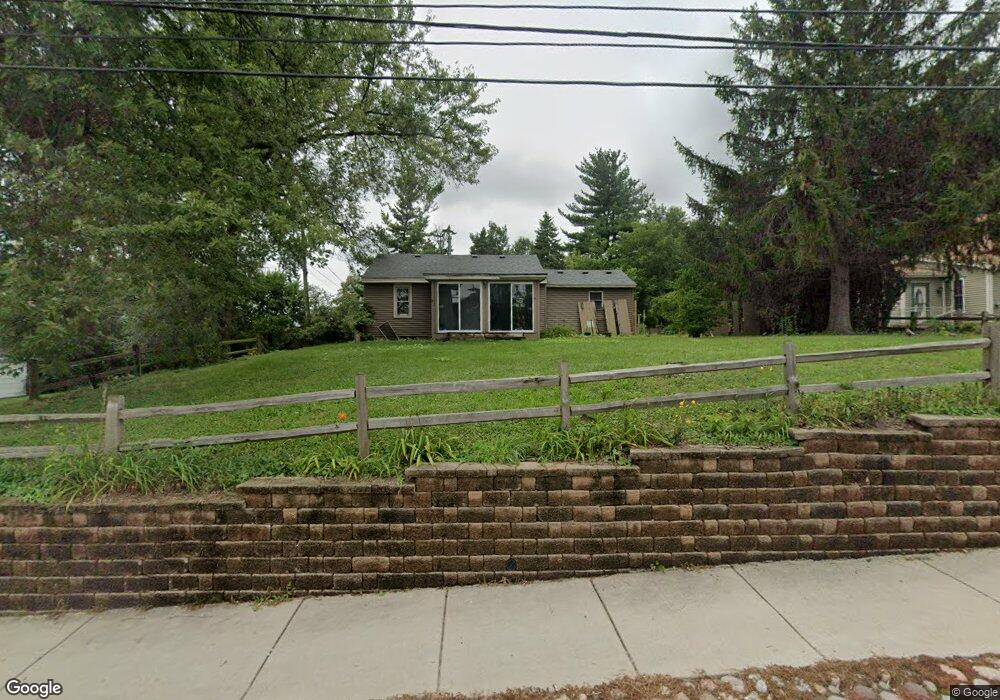
198 Reinking Rd Pingree Grove, IL 60140
Estimated Value: $192,000 - $261,000
--
Bed
--
Bath
1,354
Sq Ft
$168/Sq Ft
Est. Value
About This Home
This home is located at 198 Reinking Rd, Pingree Grove, IL 60140 and is currently estimated at $227,144, approximately $167 per square foot. 198 Reinking Rd is a home located in Kane County with nearby schools including Gary D. Wright Elementary School, Hampshire Middle School, and Hampshire High School.
Ownership History
Date
Name
Owned For
Owner Type
Purchase Details
Closed on
May 5, 2017
Sold by
Fannie Mae
Bought by
Garcia Evelina and Garcia Francisco
Current Estimated Value
Purchase Details
Closed on
Sep 27, 2016
Sold by
Frazier Suzy
Bought by
Federal National Mortgage Association
Purchase Details
Closed on
Oct 28, 2002
Sold by
Stacey Sue L
Bought by
Frazier Fredrick C and Frazier Sue L
Home Financials for this Owner
Home Financials are based on the most recent Mortgage that was taken out on this home.
Original Mortgage
$108,600
Interest Rate
6.01%
Purchase Details
Closed on
Jun 9, 2000
Sold by
Huske Joan E
Bought by
Stacey Sue L
Home Financials for this Owner
Home Financials are based on the most recent Mortgage that was taken out on this home.
Original Mortgage
$92,000
Interest Rate
8.31%
Create a Home Valuation Report for This Property
The Home Valuation Report is an in-depth analysis detailing your home's value as well as a comparison with similar homes in the area
Home Values in the Area
Average Home Value in this Area
Purchase History
| Date | Buyer | Sale Price | Title Company |
|---|---|---|---|
| Garcia Evelina | $84,000 | Title Guaranty Fund Inc | |
| Federal National Mortgage Association | -- | None Available | |
| Frazier Fredrick C | -- | Law Title Insurance Co Inc | |
| Stacey Sue L | $95,000 | Chicago Title Insurance Co |
Source: Public Records
Mortgage History
| Date | Status | Borrower | Loan Amount |
|---|---|---|---|
| Previous Owner | Frazier Fredrick C | $108,600 | |
| Previous Owner | Stacey Sue L | $92,000 |
Source: Public Records
Tax History Compared to Growth
Tax History
| Year | Tax Paid | Tax Assessment Tax Assessment Total Assessment is a certain percentage of the fair market value that is determined by local assessors to be the total taxable value of land and additions on the property. | Land | Improvement |
|---|---|---|---|---|
| 2024 | $3,638 | $55,656 | $8,951 | $46,705 |
| 2023 | $3,513 | $50,331 | $8,095 | $42,236 |
| 2022 | $3,316 | $46,406 | $7,464 | $38,942 |
| 2021 | $3,238 | $43,647 | $7,020 | $36,627 |
| 2020 | $3,015 | $40,195 | $6,841 | $33,354 |
| 2019 | $2,957 | $38,579 | $6,566 | $32,013 |
| 2018 | $2,879 | $36,207 | $6,162 | $30,045 |
| 2017 | $2,815 | $34,480 | $5,868 | $28,612 |
| 2016 | $2,302 | $32,825 | $5,586 | $27,239 |
| 2015 | -- | $31,002 | $5,276 | $25,726 |
| 2014 | -- | $30,688 | $5,591 | $25,097 |
| 2013 | -- | $31,250 | $5,693 | $25,557 |
Source: Public Records
Map
Nearby Homes
- 3301 U S 20
- 703 Anchorage Ct
- 695 Anchorage Ct
- 14N515 Highland Ave
- 638 Dover St
- 905 Shelter Island Ln
- 395 Brookhaven Trail
- 41W625 U S 20
- 410 Brookhaven Trail
- 700 Brighton Dr
- 760 Canterbury Ln
- 975 Valley Stream Dr
- 726 Bristol St
- 3708 Peregrine Way
- 562 Lancaster Dr
- 801 Marlisle Ln
- 3704 Heathmoor Dr
- Lot 019 Old Stage Rd
- Lot 88 Broadleaf Ave
- Riverton Plan at Highland Woods
- 14N198 Reinking Rd
- 212 Reinking Rd
- 14N180 Reinking Rd
- 205 Reinking Rd
- 207 Reinking Rd
- 230 Reinking Rd
- 235 Reinking Rd
- 125 Mansfield St
- 14N171 Reinking Rd
- 133 Norfolk Ln
- 14N152 Reinking Rd
- 14N155 Reinking Rd
- 149 Norfolk Ln
- 141 Norfolk Ln
- 167 Norfolk Ln
- 175 Norfolk Ln
- 183 Norfolk Ln
- 166 Norfolk Ln
- 174 Norfolk Ln
- 191 Norfolk Ln