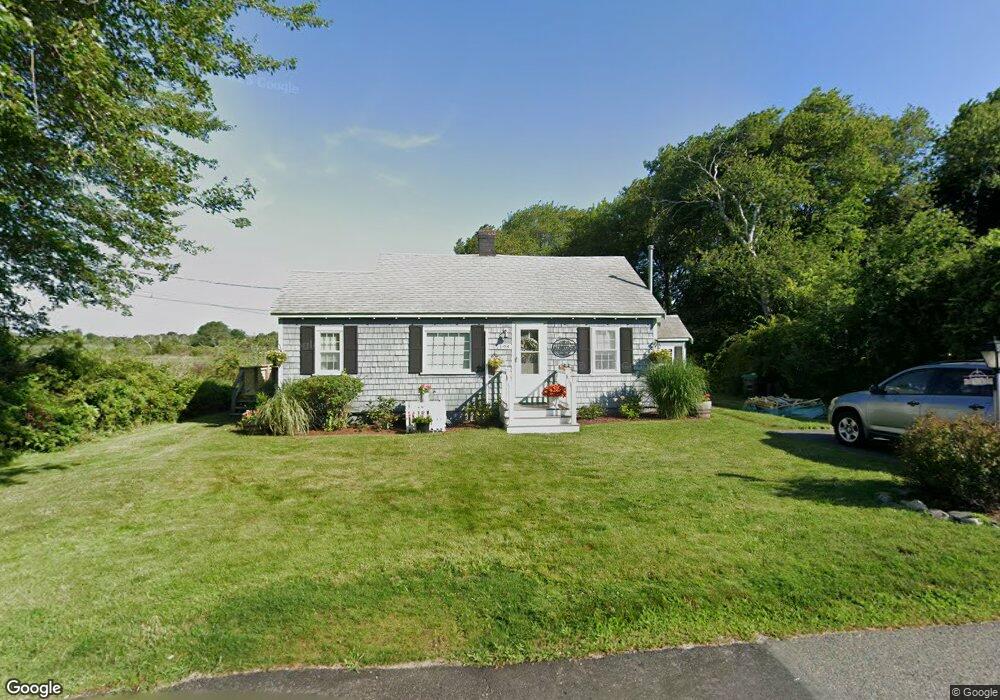
198 Saginaw Ave Marshfield, MA 02050
Ocean Bluff-Brant Rock NeighborhoodEstimated Value: $533,000 - $595,000
2
Beds
1
Bath
1,059
Sq Ft
$529/Sq Ft
Est. Value
About This Home
This home is located at 198 Saginaw Ave, Marshfield, MA 02050 and is currently estimated at $560,668, approximately $529 per square foot. 198 Saginaw Ave is a home with nearby schools including Governor Edward Winslow School, Furnace Brook Middle School, and Marshfield High School.
Ownership History
Date
Name
Owned For
Owner Type
Purchase Details
Closed on
Jan 8, 2010
Sold by
Rankin Dorothy M and Aldridge Joan R
Bought by
Aldridge Joan R
Current Estimated Value
Purchase Details
Closed on
Nov 28, 2007
Sold by
Rankin Dorothy M
Bought by
Aldridge Joan R
Create a Home Valuation Report for This Property
The Home Valuation Report is an in-depth analysis detailing your home's value as well as a comparison with similar homes in the area
Home Values in the Area
Average Home Value in this Area
Purchase History
| Date | Buyer | Sale Price | Title Company |
|---|---|---|---|
| Aldridge Joan R | -- | -- | |
| Aldridge Joan R | -- | -- | |
| Aldridge Joan R | -- | -- | |
| Aldridge Joan R | -- | -- |
Source: Public Records
Mortgage History
| Date | Status | Borrower | Loan Amount |
|---|---|---|---|
| Open | Aldridge Joan R | $160,000 |
Source: Public Records
Tax History Compared to Growth
Tax History
| Year | Tax Paid | Tax Assessment Tax Assessment Total Assessment is a certain percentage of the fair market value that is determined by local assessors to be the total taxable value of land and additions on the property. | Land | Improvement |
|---|---|---|---|---|
| 2025 | $4,807 | $485,600 | $321,200 | $164,400 |
| 2024 | $4,628 | $445,400 | $301,100 | $144,300 |
| 2023 | $4,364 | $396,200 | $271,000 | $125,200 |
| 2022 | $4,364 | $337,000 | $230,800 | $106,200 |
| 2021 | $4,167 | $315,900 | $220,800 | $95,100 |
| 2020 | $3,810 | $285,800 | $190,700 | $95,100 |
| 2019 | $3,744 | $279,800 | $190,700 | $89,100 |
| 2018 | $3,683 | $275,500 | $190,700 | $84,800 |
| 2017 | $3,511 | $255,900 | $180,700 | $75,200 |
| 2016 | $3,365 | $242,400 | $170,600 | $71,800 |
| 2015 | $3,218 | $242,100 | $170,600 | $71,500 |
| 2014 | $3,163 | $238,000 | $170,600 | $67,400 |
Source: Public Records
Map
Nearby Homes