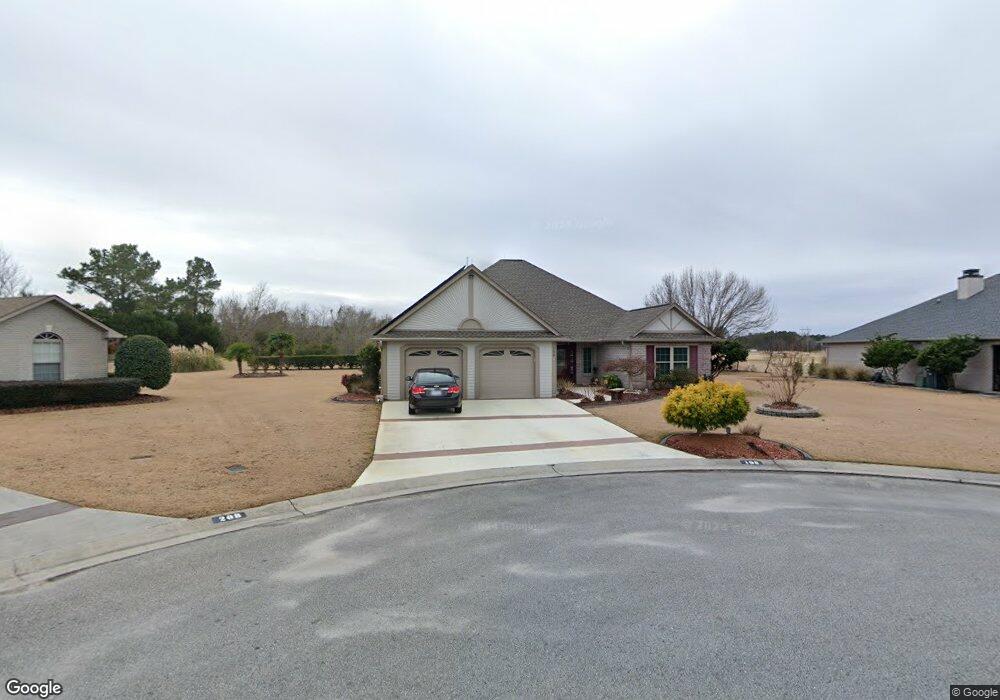
198 Windsor Ct Hampstead, NC 28443
Estimated Value: $448,000 - $541,000
4
Beds
3
Baths
3,041
Sq Ft
$162/Sq Ft
Est. Value
About This Home
This home is located at 198 Windsor Ct, Hampstead, NC 28443 and is currently estimated at $493,592, approximately $162 per square foot. 198 Windsor Ct is a home located in Pender County with nearby schools including South Topsail Elementary School, Topsail Middle School, and Topsail High School.
Ownership History
Date
Name
Owned For
Owner Type
Purchase Details
Closed on
Sep 1, 2021
Sold by
Black George and Block Christina
Bought by
Block George and Block Christina
Current Estimated Value
Home Financials for this Owner
Home Financials are based on the most recent Mortgage that was taken out on this home.
Original Mortgage
$343,000
Outstanding Balance
$261,814
Interest Rate
2.1%
Mortgage Type
New Conventional
Estimated Equity
$231,778
Purchase Details
Closed on
Jul 19, 2005
Sold by
Oleary Robert T and Oleary Diane E Mcauliffe
Bought by
Block George R and Block Christina M
Home Financials for this Owner
Home Financials are based on the most recent Mortgage that was taken out on this home.
Original Mortgage
$55,800
Interest Rate
5.59%
Mortgage Type
Purchase Money Mortgage
Purchase Details
Closed on
Jan 9, 2004
Bought by
Block George
Create a Home Valuation Report for This Property
The Home Valuation Report is an in-depth analysis detailing your home's value as well as a comparison with similar homes in the area
Home Values in the Area
Average Home Value in this Area
Purchase History
| Date | Buyer | Sale Price | Title Company |
|---|---|---|---|
| Block George | -- | None Available | |
| Block George R | $62,000 | -- | |
| Block George | -- | -- |
Source: Public Records
Mortgage History
| Date | Status | Borrower | Loan Amount |
|---|---|---|---|
| Open | Block George | $343,000 | |
| Closed | Block George R | $55,800 |
Source: Public Records
Tax History Compared to Growth
Tax History
| Year | Tax Paid | Tax Assessment Tax Assessment Total Assessment is a certain percentage of the fair market value that is determined by local assessors to be the total taxable value of land and additions on the property. | Land | Improvement |
|---|---|---|---|---|
| 2024 | $2,867 | $288,347 | $76,847 | $211,500 |
| 2023 | $2,867 | $288,347 | $76,847 | $211,500 |
| 2022 | $2,510 | $288,347 | $76,847 | $211,500 |
| 2021 | $2,510 | $288,347 | $76,847 | $211,500 |
| 2020 | $2,406 | $275,806 | $76,847 | $198,959 |
| 2019 | $2,406 | $275,806 | $76,847 | $198,959 |
| 2018 | $2,587 | $283,872 | $60,000 | $223,872 |
| 2017 | $2,587 | $283,872 | $60,000 | $223,872 |
| 2016 | $2,668 | $283,872 | $60,000 | $223,872 |
| 2015 | $2,633 | $283,872 | $60,000 | $223,872 |
| 2014 | $2,074 | $283,872 | $60,000 | $223,872 |
| 2013 | -- | $283,872 | $60,000 | $223,872 |
| 2012 | -- | $283,872 | $60,000 | $223,872 |
Source: Public Records
Map
Nearby Homes
- 607 Castle Bay Dr
- 399 Castle Bay Dr Unit D
- 115 Castle Bay Dr
- 325 Highlands Dr
- 82 Highlands Dr
- 35 Scotlands Ct
- 614 Saint Johns Church Rd
- 58 Draft Line Ct
- 609 & 633 Saint Johns Church Rd
- 18 E Pioneer Way Unit 74
- 17 E Farley Dr Unit 70
- 25 E Farley Dr Unit 69
- 12 W Farley Dr Unit 102
- 24 W Farley Dr Unit 99
- 28 W Farley Dr Unit 98
- 48 W Farley Dr Unit 93
- 155 Cobbler Way Unit 48
- 139 Cobbler Way Unit 46
- 131 Cobbler Way Unit 45
- 123 Cobbler Way Unit 44
- 208 Windsor Ct
- 188 Windsor Ct
- 207 Windsor Ct
- 205 Windsor Ct
- 189 Windsor Ct
- 162 Windsor Ct
- 142 Windsor Ct
- 151 Windsor Ct
- 126 Windsor Ct
- 137 Windsor Ct
- 123 Windsor Ct
- 106 Windsor Ct
- 100 Lot Windsor Ct
- 100 Windsor Ct
- 101 Windsor Ct
- 117 Windsor Ct
- 119 Windsor Ct
- Lot 101 Windsor Ct
- 114-Lot Windsor Ct
- 114 Windsor Ct