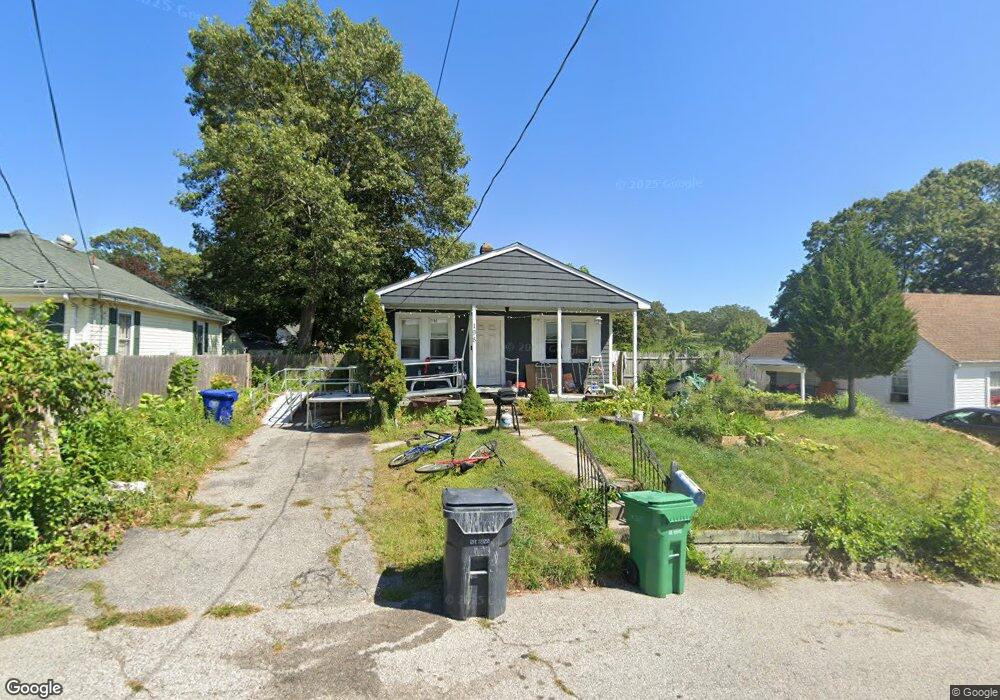
198 Wingate Ave Warwick, RI 02888
Lakewood NeighborhoodEstimated Value: $325,000 - $364,000
2
Beds
1
Bath
840
Sq Ft
$406/Sq Ft
Est. Value
About This Home
This home is located at 198 Wingate Ave, Warwick, RI 02888 and is currently estimated at $341,215, approximately $406 per square foot. 198 Wingate Ave is a home located in Kent County with nearby schools including St. Peter School.
Ownership History
Date
Name
Owned For
Owner Type
Purchase Details
Closed on
Nov 10, 2015
Sold by
Sawyer Stephanie and Peloquin Nathaniel A
Bought by
Peloquin Stephanie M and Peloquin Nathaniel A
Current Estimated Value
Purchase Details
Closed on
Jun 16, 2008
Sold by
Us Bank Na
Bought by
Sawyer Stephanie and Peloquin Nathanie A
Purchase Details
Closed on
Mar 12, 1999
Sold by
Koussa David G and Koussa Victoria J
Bought by
Cox Philip R and Cox Lisa R
Create a Home Valuation Report for This Property
The Home Valuation Report is an in-depth analysis detailing your home's value as well as a comparison with similar homes in the area
Home Values in the Area
Average Home Value in this Area
Purchase History
| Date | Buyer | Sale Price | Title Company |
|---|---|---|---|
| Peloquin Stephanie M | -- | -- | |
| Sawyer Stephanie | $101,000 | -- | |
| Cox Philip R | $82,000 | -- |
Source: Public Records
Mortgage History
| Date | Status | Borrower | Loan Amount |
|---|---|---|---|
| Previous Owner | Cox Philip R | $199,750 | |
| Previous Owner | Cox Philip R | $157,500 | |
| Previous Owner | Cox Philip R | $135,000 |
Source: Public Records
Tax History
| Year | Tax Paid | Tax Assessment Tax Assessment Total Assessment is a certain percentage of the fair market value that is determined by local assessors to be the total taxable value of land and additions on the property. | Land | Improvement |
|---|---|---|---|---|
| 2025 | $3,487 | $274,600 | $100,300 | $174,300 |
| 2024 | $3,361 | $232,300 | $87,200 | $145,100 |
| 2023 | $3,296 | $232,300 | $87,200 | $145,100 |
| 2022 | $3,087 | $164,800 | $56,100 | $108,700 |
| 2021 | $3,087 | $164,800 | $56,100 | $108,700 |
| 2020 | $3,087 | $164,800 | $56,100 | $108,700 |
| 2019 | $3,087 | $164,800 | $56,100 | $108,700 |
| 2018 | $2,552 | $122,700 | $56,100 | $66,600 |
| 2017 | $2,483 | $122,700 | $56,100 | $66,600 |
| 2016 | $2,483 | $122,700 | $56,100 | $66,600 |
| 2015 | $2,399 | $115,600 | $54,800 | $60,800 |
| 2014 | $2,319 | $115,600 | $54,800 | $60,800 |
| 2013 | $2,288 | $115,600 | $54,800 | $60,800 |
Source: Public Records
Map
Nearby Homes
- 0 Elmwood Ave
- 123 Harrington Ave
- 80 George St
- 35 Welfare Ave
- 136 Sherwood Ave
- 120 Sherwood Ave
- 127 Sherwood Ave
- 111 Sherwood Ave
- 171 Sherwood Ave
- 821 Post Rd
- 22 Phillips Ave
- 27 Frederick St
- 1052 Post Rd
- 25 Newfield Ave
- 65 Perkins Ave
- 150 Riverside Ave
- 129 1st Ave
- 175 Pettaconsett Ave
- 103 Harper Ave
- 25 Sharon St Unit 2
Your Personal Tour Guide
Ask me questions while you tour the home.