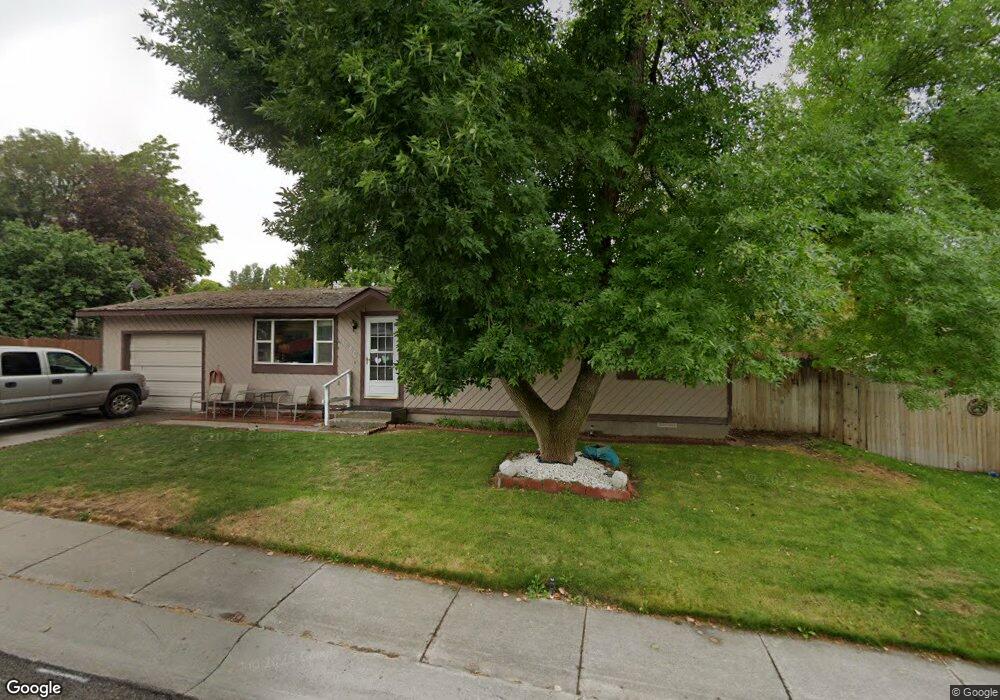
1980 Case St Winnemucca, NV 89445
Estimated Value: $283,000 - $292,000
3
Beds
1
Bath
1,008
Sq Ft
$286/Sq Ft
Est. Value
About This Home
This home is located at 1980 Case St, Winnemucca, NV 89445 and is currently estimated at $288,391, approximately $286 per square foot. 1980 Case St is a home located in Humboldt County with nearby schools including Sonoma Heights Elementary School, French Ford Middle School, and Winnemucca Junior High School.
Ownership History
Date
Name
Owned For
Owner Type
Purchase Details
Closed on
Sep 10, 2013
Sold by
Nye Sean D
Bought by
Page Doland Ray and Page Nora M
Current Estimated Value
Home Financials for this Owner
Home Financials are based on the most recent Mortgage that was taken out on this home.
Original Mortgage
$142,857
Outstanding Balance
$106,534
Interest Rate
4.46%
Mortgage Type
New Conventional
Estimated Equity
$181,857
Purchase Details
Closed on
Dec 26, 2007
Sold by
Roberts Greg and Roberts Shannon
Bought by
Nye Sean D
Home Financials for this Owner
Home Financials are based on the most recent Mortgage that was taken out on this home.
Original Mortgage
$100,700
Interest Rate
5.96%
Mortgage Type
New Conventional
Purchase Details
Closed on
Sep 18, 2005
Sold by
Ray Walter W and Ray Carol J
Bought by
Roberts Greg and Roberts Shannon
Home Financials for this Owner
Home Financials are based on the most recent Mortgage that was taken out on this home.
Original Mortgage
$81,500
Interest Rate
5.63%
Create a Home Valuation Report for This Property
The Home Valuation Report is an in-depth analysis detailing your home's value as well as a comparison with similar homes in the area
Purchase History
| Date | Buyer | Sale Price | Title Company |
|---|---|---|---|
| Page Doland Ray | $140,000 | Western Title Company | |
| Nye Sean D | $140,000 | Western Title Company | |
| Nye Sean D | $125,900 | Western Title Company Inc | |
| Roberts Greg | -- | Western Title |
Source: Public Records
Mortgage History
| Date | Status | Borrower | Loan Amount |
|---|---|---|---|
| Open | Page Doland Ray | $142,857 | |
| Previous Owner | Nye Sean D | $100,700 | |
| Previous Owner | Roberts Greg | $81,500 |
Source: Public Records
Tax History
| Year | Tax Paid | Tax Assessment Tax Assessment Total Assessment is a certain percentage of the fair market value that is determined by local assessors to be the total taxable value of land and additions on the property. | Land | Improvement |
|---|---|---|---|---|
| 2025 | $992 | $30,362 | $11,200 | $19,162 |
| 2024 | $966 | $30,836 | $11,200 | $19,636 |
| 2023 | $966 | $28,035 | $9,275 | $18,760 |
| 2022 | $917 | $25,513 | $9,275 | $16,238 |
| 2021 | $923 | $25,693 | $9,275 | $16,418 |
| 2020 | $942 | $26,286 | $9,275 | $17,011 |
| 2019 | $930 | $25,926 | $9,275 | $16,651 |
| 2018 | $924 | $25,733 | $9,275 | $16,458 |
| 2017 | $931 | $25,950 | $9,275 | $16,675 |
| 2016 | $950 | $26,992 | $9,275 | $17,717 |
| 2015 | $1,022 | $27,010 | $9,275 | $17,735 |
| 2014 | $1,022 | $26,889 | $9,275 | $17,614 |
Source: Public Records
Map
Nearby Homes
- 273 Mccoy St
- 1767 Scott St
- 5270 Marla Dr Unit 14
- 160 Circle Dr
- 702 W Mcarthur Ave Unit 9
- 5070 Offenhauser Dr
- 5248 Foothill Dr Unit 44
- Lot 16059313 Offenhauser Dr
- Lot 16059212 Offenhauser Dr
- Lot 16059312 Offenhauser Dr
- Lot 16059303 Offenhauser Dr
- Lot 16059209 Offenhauser Dr
- Lot 16059301 Offenhauser Dr
- Lot 16059211 Offenhauser Dr
- Lot 16059305 Offenhauser Dr
- Lot 16059309 Offenhauser Dr
- Lot 16059311 Offenhauser Dr
- 5252 Halter Way Unit 32
- 5285 Marla Dr Unit 3
- 5254 Halter Way Unit 31
Your Personal Tour Guide
Ask me questions while you tour the home.