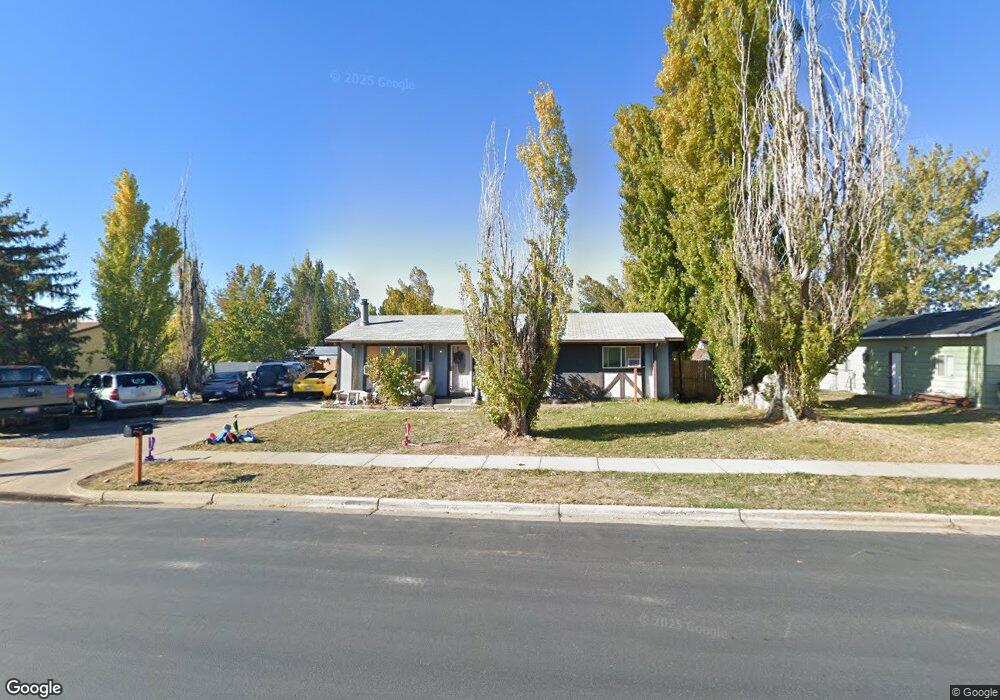
1980 S 3300 W Syracuse, UT 84075
Estimated Value: $419,000 - $448,448
3
Beds
1
Bath
1,180
Sq Ft
$370/Sq Ft
Est. Value
About This Home
This home is located at 1980 S 3300 W, Syracuse, UT 84075 and is currently estimated at $437,112, approximately $370 per square foot. 1980 S 3300 W is a home located in Davis County with nearby schools including Buffalo Point School, Syracuse Junior High School, and Syracuse High School.
Ownership History
Date
Name
Owned For
Owner Type
Purchase Details
Closed on
May 10, 2010
Sold by
Bostock Richard and Bostock Shauna
Bought by
Bostock Richard and Bostock Shauna
Current Estimated Value
Purchase Details
Closed on
Mar 20, 2009
Sold by
Bostock Richard and Bostock Shauna
Bought by
Bostock Richard and Bostock Shauna
Home Financials for this Owner
Home Financials are based on the most recent Mortgage that was taken out on this home.
Original Mortgage
$149,826
Outstanding Balance
$95,370
Interest Rate
5.15%
Mortgage Type
FHA
Estimated Equity
$341,742
Purchase Details
Closed on
Sep 4, 2001
Sold by
Fox Capital Corp
Bought by
Bastock Richard and Antes Shanna
Home Financials for this Owner
Home Financials are based on the most recent Mortgage that was taken out on this home.
Original Mortgage
$96,050
Interest Rate
11.99%
Purchase Details
Closed on
Dec 28, 2000
Sold by
Hewitt Frank Lynn and Hewitt Susan Lorraine
Bought by
Fox Capital Corp
Create a Home Valuation Report for This Property
The Home Valuation Report is an in-depth analysis detailing your home's value as well as a comparison with similar homes in the area
Home Values in the Area
Average Home Value in this Area
Purchase History
| Date | Buyer | Sale Price | Title Company |
|---|---|---|---|
| Bostock Richard | -- | Attorneys Title Guaran | |
| Bostock Richard | -- | Patriot National Title Ins A | |
| Bastock Richard | -- | Backman Stewart Title Servic | |
| Fox Capital Corp | $72,630 | -- |
Source: Public Records
Mortgage History
| Date | Status | Borrower | Loan Amount |
|---|---|---|---|
| Open | Bostock Richard | $149,826 | |
| Closed | Bastock Richard | $96,050 |
Source: Public Records
Tax History Compared to Growth
Tax History
| Year | Tax Paid | Tax Assessment Tax Assessment Total Assessment is a certain percentage of the fair market value that is determined by local assessors to be the total taxable value of land and additions on the property. | Land | Improvement |
|---|---|---|---|---|
| 2025 | $2,098 | $202,400 | $123,926 | $78,474 |
| 2024 | $2,061 | $200,200 | $111,660 | $88,540 |
| 2023 | $1,932 | $342,000 | $154,892 | $187,108 |
| 2022 | $2,046 | $198,550 | $84,948 | $113,602 |
| 2021 | $1,811 | $272,000 | $122,895 | $149,105 |
| 2020 | $1,547 | $225,000 | $107,777 | $117,223 |
| 2019 | $1,526 | $219,000 | $106,809 | $112,191 |
| 2018 | $1,326 | $189,000 | $101,160 | $87,840 |
| 2016 | $1,138 | $85,030 | $38,554 | $46,476 |
| 2015 | $1,083 | $77,110 | $38,554 | $38,556 |
| 2014 | $1,122 | $81,380 | $38,554 | $42,826 |
| 2013 | -- | $75,667 | $32,910 | $42,757 |
Source: Public Records
Map
Nearby Homes
- 3360 W 2280 S
- 3704 W 2170 S Unit 111
- 2982 S 3000 W
- 2912 S 3000 W
- 2961 S 2425 W Unit 1123
- 1430 Heather Ln
- 3478 Brookshire Dr
- 2524 S 3590 W Unit 602
- 2965 S 3000 W
- 2971 S 2425 W Unit 1124
- 2686 S 2440 W Unit 101
- 2635 S 2430 W Unit 114
- 3062 W Solace St
- 2696 2495 S Unit 207
- 2726 2495 S Unit 205
- 2679 W Antelope Dr
- 2735 S Shoreline Dr
- 3867 Rungsted Cir
- 2840 W 1200 S
- 3951 Baltimore Cir