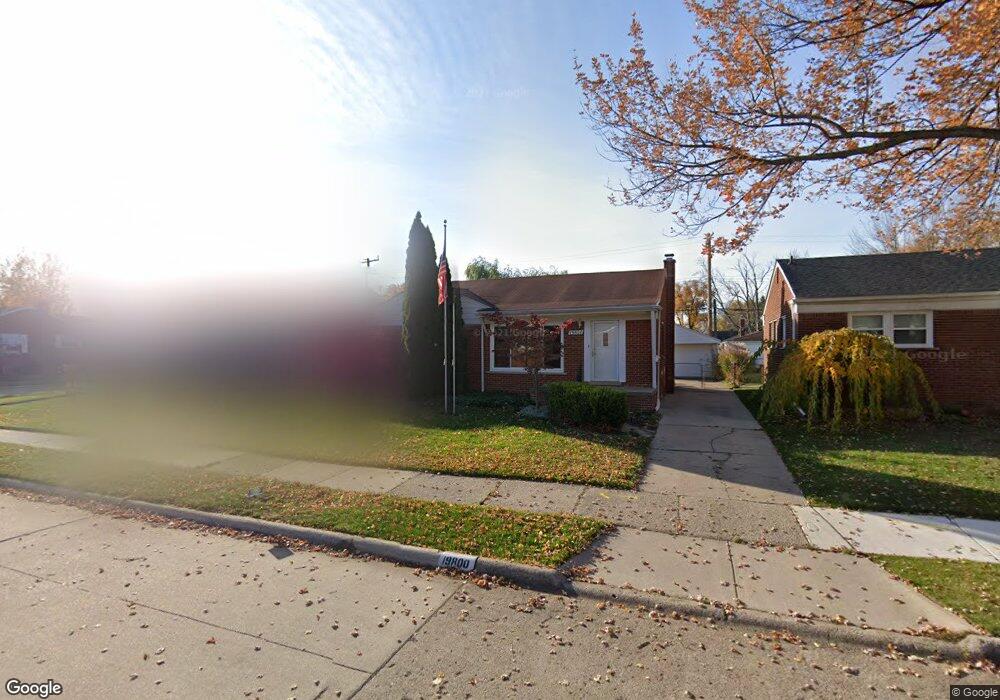
19800 Gaukler St Unit Bldg-Unit Saint Clair Shores, MI 48080
Estimated Value: $214,166 - $254,000
3
Beds
1
Bath
1,090
Sq Ft
$211/Sq Ft
Est. Value
About This Home
This home is located at 19800 Gaukler St Unit Bldg-Unit, Saint Clair Shores, MI 48080 and is currently estimated at $229,542, approximately $210 per square foot. 19800 Gaukler St Unit Bldg-Unit is a home located in Macomb County with nearby schools including South Lake Middle School, South Lake High School, and St. Joan of Arc Elementary School.
Ownership History
Date
Name
Owned For
Owner Type
Purchase Details
Closed on
Jul 20, 2018
Sold by
Brown Jeanine
Bought by
Pachecoflores Nefhtalle
Current Estimated Value
Home Financials for this Owner
Home Financials are based on the most recent Mortgage that was taken out on this home.
Original Mortgage
$140,000
Outstanding Balance
$121,599
Interest Rate
4.6%
Mortgage Type
VA
Estimated Equity
$107,943
Purchase Details
Closed on
Oct 8, 2009
Sold by
Rainey Betty L and The Bertha Sharp Trust
Bought by
Brown Jeanine
Purchase Details
Closed on
Feb 13, 2009
Sold by
Sharp Bertha and Sharp Alton S
Bought by
Rainey Betty L and Bertha A Sharp Trust
Create a Home Valuation Report for This Property
The Home Valuation Report is an in-depth analysis detailing your home's value as well as a comparison with similar homes in the area
Home Values in the Area
Average Home Value in this Area
Purchase History
| Date | Buyer | Sale Price | Title Company |
|---|---|---|---|
| Pachecoflores Nefhtalle | $155,000 | Amrock Inc | |
| Brown Jeanine | $69,000 | Devon Title | |
| Rainey Betty L | -- | None Available |
Source: Public Records
Mortgage History
| Date | Status | Borrower | Loan Amount |
|---|---|---|---|
| Open | Pachecoflores Nefhtalle | $140,000 |
Source: Public Records
Tax History Compared to Growth
Tax History
| Year | Tax Paid | Tax Assessment Tax Assessment Total Assessment is a certain percentage of the fair market value that is determined by local assessors to be the total taxable value of land and additions on the property. | Land | Improvement |
|---|---|---|---|---|
| 2025 | $4,621 | $102,000 | $0 | $0 |
| 2024 | $4,514 | $96,800 | $0 | $0 |
| 2023 | $4,301 | $86,700 | $0 | $0 |
| 2022 | $0 | $0 | $0 | $0 |
| 2021 | $3,484 | $70,100 | $0 | $0 |
| 2020 | $3,499 | $69,600 | $0 | $0 |
| 2019 | $2,227 | $62,500 | $0 | $0 |
| 2018 | $2,363 | $49,200 | $0 | $0 |
| 2017 | $2,363 | $44,800 | $7,400 | $37,400 |
| 2016 | $2,227 | $44,800 | $0 | $0 |
| 2015 | $2,188 | $38,800 | $0 | $0 |
| 2013 | -- | $37,200 | $0 | $0 |
| 2012 | -- | $38,900 | $6,800 | $32,100 |
Source: Public Records
Map
Nearby Homes
- 19912 Alger St
- 19813 Rosedale St
- 19816 Rosedale St
- 19820 Avalon St
- 19806 Shady Lane Ave
- 20020 Shady Lane Ave
- 22533 Raven Ave
- 22584 Marine Ave
- 20308 Shady Lane Ave
- 19000 Rosetta Ave
- 20505 Shady Lane Ave
- 20025 Chalon St
- 21407 Pallister St
- 19105 Ash Ave
- 20618 Sunnyside St
- 20624 Sunnyside St
- 22859 Grove St Unit 53
- 22400 Kelly Rd
- 20207 Chalon St
- 20406 Mauer St
- 19800 Gaukler St
- 19804 Gaukler St
- 19712 Gaukler St Unit Bldg-Unit
- 19712 Gaukler St
- 19801 Alger St
- 19717 Alger St
- 19805 Alger St
- 19713 Alger St
- 19708 Gaukler St
- 19808 Gaukler St
- 19801 Gaukler St
- 19805 Gaukler St
- 19717 Gaukler St
- 19709 Alger St
- 19809 Alger St
- 19713 Gaukler St
- 19704 Gaukler St
- 19812 Gaukler St
- 19809 Gaukler St
- 19813 Alger St