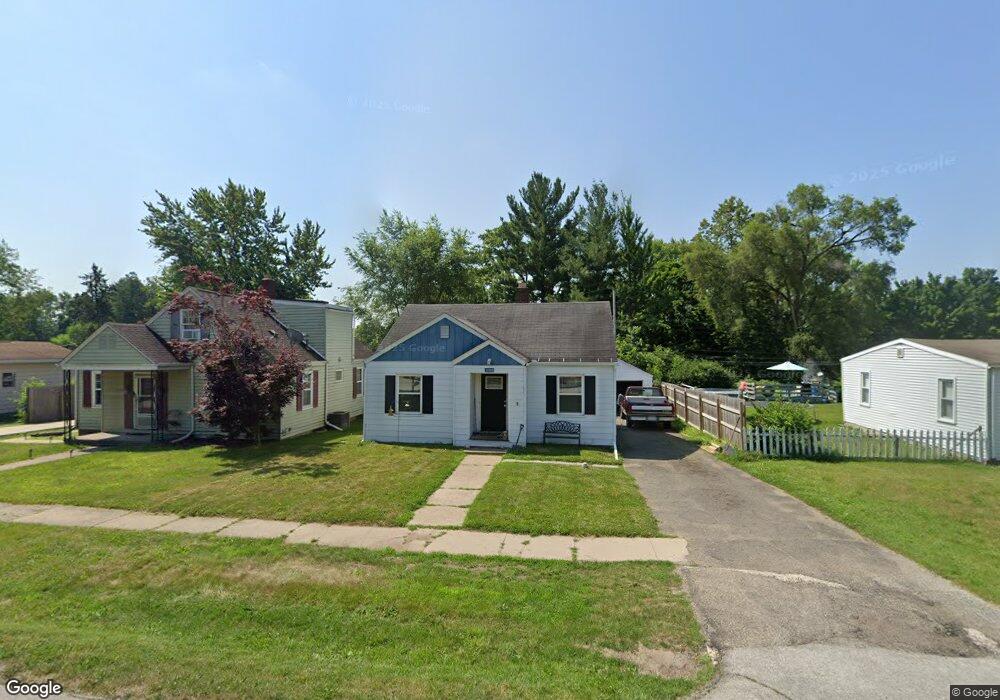
19806 Yoder St South Bend, IN 46614
Estimated Value: $126,000 - $190,000
3
Beds
1
Bath
964
Sq Ft
$161/Sq Ft
Est. Value
About This Home
This home is located at 19806 Yoder St, South Bend, IN 46614 and is currently estimated at $155,150, approximately $160 per square foot. 19806 Yoder St is a home located in St. Joseph County with nearby schools including Hay Elementary School, Marshall Traditional School, and Clay Intermediate Center.
Ownership History
Date
Name
Owned For
Owner Type
Purchase Details
Closed on
Feb 8, 2019
Sold by
Windgate Properties Llc
Bought by
Bh Investments Llc
Current Estimated Value
Purchase Details
Closed on
Jan 2, 2019
Sold by
Auditor Of The County Of St Joseph
Bought by
Windgate Properties Llc
Create a Home Valuation Report for This Property
The Home Valuation Report is an in-depth analysis detailing your home's value as well as a comparison with similar homes in the area
Home Values in the Area
Average Home Value in this Area
Purchase History
| Date | Buyer | Sale Price | Title Company |
|---|---|---|---|
| Bh Investments Llc | -- | None Listed On Document | |
| Windgate Properties Llc | $6,101 | None Listed On Document |
Source: Public Records
Tax History Compared to Growth
Tax History
| Year | Tax Paid | Tax Assessment Tax Assessment Total Assessment is a certain percentage of the fair market value that is determined by local assessors to be the total taxable value of land and additions on the property. | Land | Improvement |
|---|---|---|---|---|
| 2024 | $2,237 | $92,000 | $37,400 | $54,600 |
| 2023 | $2,203 | $91,800 | $37,400 | $54,400 |
| 2022 | $2,203 | $91,800 | $37,400 | $54,400 |
| 2021 | $2,239 | $91,300 | $6,300 | $85,000 |
| 2020 | $1,949 | $79,200 | $5,300 | $73,900 |
| 2019 | $1,704 | $82,800 | $5,300 | $77,500 |
| 2018 | $1,679 | $72,800 | $4,600 | $68,200 |
| 2017 | $479 | $71,700 | $4,600 | $67,100 |
| 2016 | $471 | $61,300 | $3,900 | $57,400 |
| 2014 | $397 | $60,200 | $3,900 | $56,300 |
Source: Public Records
Map
Nearby Homes
- 19570 Dice St
- 19711 Pasadena Ave
- 525 Yoder St Unit 49
- 520 Yoder St Unit 50
- 522 Dice St
- 19746 Detroit Ave
- 20485 Jewell Ave
- 20440 Jewell Ave Unit 24
- 20454 Jewell Ave
- 19694 Ruth Ave
- 519 E Johnson Rd
- 60091 Carroll St
- 734 Dice St Unit 95
- 20305 Topaz St
- 737 Dice Ct Unit 93
- 0 Clara St
- 19627 Southland Ave
- 60020 Scott St
- 60175 Emerald Dr
- 20312 Garnet Dr